New in SSMS - Always On Availability Group Latency Reports
With SQL Server 2012 we introduced Always On Availability Groups, and the Always On Availability Group Dashboard in SQL Server Management Studio (SSMS). This dashboard can be utilized by database administrators to view the current health of an Availability Group and its availability replicas and databases. While the dashboard can be configured to provide information regarding the latency between Primary and Secondary Replicas (can be calculated using the Commit LSN, Sent LSN and harden LSN values), it does not provide insights into the reason for the latency. To understand the reason for latency, requires capture and analysis of Extended Events and Performance Monitor counters. This activity can be time consuming and requires extensive knowledge of the Extended Events associated with Always On.
With the new SSMS 17.4 release, we are introducing the Availability Group Latency data collection and reporting built into the Availability Group dashboard. This feature masks the capture and analysis of the Extended Events from the end user and provides an easy to understand report detailing the time spent during the various phases of the Log Transport process.
What to use it for?
The Latency data collection functionality and the associated reports allows a database administrator to quickly discern the bottleneck in the log transport flow between the Primary and the Secondary replicas of an Availability Group. This feature does NOT answer the question "Is there latency in the Availability Group deployment? " but rather provides a way to understand why there is latency in the Availability Group Deployment. This functionality provides a way to narrow down the potential cause of latency in an Availability Group deployment.
How does it Work?
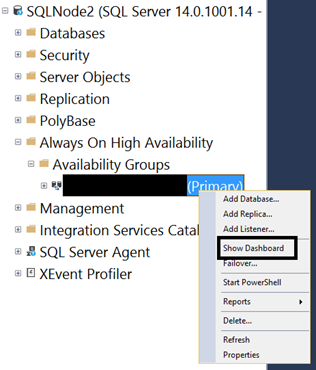
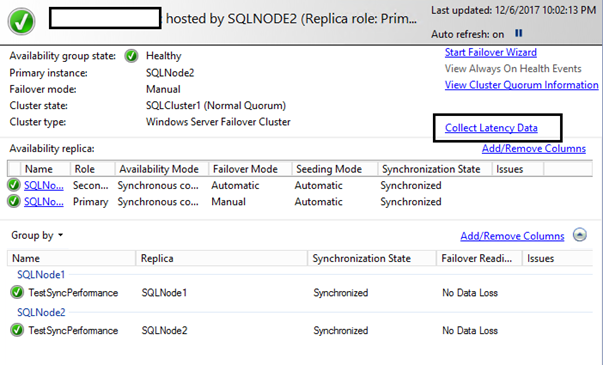
As seen below, the Availability Group Latency Data Collection functionality can be accessed from the Availability Group Dashboard.


When an admin clicks on the "Collect Latency Data" link, SSMS behind the scenes connects to all the Replicas in the Availability and performs the following tasks.
- Checks if SQL Agent is running or not. For the latency Data collection to work, we require SQL Agent to be running on at least one secondary replica and the Primary Replica.

- Create a SQL Agent Job with the name "AlwaysOn_Latency_Data_Collection". This job has 7 steps for
- Collect Availability Group Information. This information is persisted (till the next SQL Server restart or the next execution of the job) in a table "AGInfo" in the TempDB database.
- Create an Extended Event Session for Availability Group data collection on the Replica
- Wait for the Extended Event to complete. At present we run the collection for a duration of 2 minutes. While this duration can be modified, we do not recommend users to modify this value. Modifying the duration affects the amount of time the Extended event session runs (and the data it collects) and will have a direct impact on the subsequent data extraction phase.
- End Extended Event session
- Extract the XML data from the Extended Event session into a temporary table and then parse the XML event information into "DMReplicaEvents" table in the TempDB database.
- Populate the results set for the Latency Reports
- Drop the Extended Event Session.
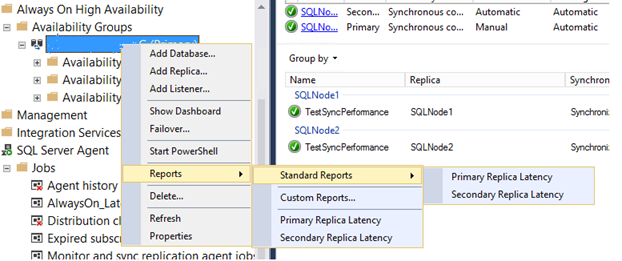
Once the job execution has completed on all the replicas, the latency information can be viewed using the new Latency Reports, Primary Replica Latency Report and the Secondary Replica Latency Report. As the name suggests, the primary Replica latency report applies to the Primary Replica, while the Secondary Replica Latency Report applies to all the secondary replicas in the Availability Group.
These reports are available as Standard Reports for the Availability Groups as shown below

Primary Replica Latency Report
The primary replica latency report has 3 sections. The first section provides Replica information for the AG.
|
|||||||||||||||
|
|||||||||||||||
The Second section provides a graphical view of the avg. Commit time on the Primary Replica and the avg. remote Hardening time for all the secondary replicas. This information is based on the values retuned by the hadr_db_commit_mgr_harden and the hadr_receive_harden_lsn_message. For more information on these extended events refer here.


The third and final section of the report provides numerical values for commit duration, remote hardening duration, time spent in compression and send duration for the log block.

The following values are reported by the Primary Replica Latency Report
- Commit Time – Avg. Time to commit a transaction on the Primary Replica.
- Remote Harden Time – Time elapsed between sending a log block to a secondary replica and getting the associated harden_lsn message back from the secondary replicas. This would include the following
- Time spent in sending the log block to the UCS layer - Reported in the Primary Replica Report
- Time spent in sending the Log block to the Secondary over the network – NOT reported in any of the reports.
- Time spent in receiving the log block from the UCS layer on the Secondary Replica - Reported in the Secondary Replica Report
- Time spent in decompressing the log Block on the secondary replica. - Reported in the Primary Replica Report
- Time spent in writing the log block to the disk on the secondary replica - Reported in the Primary Replica Report
- Time spent in send the acknowledgement to the UCS Layer on the Secondary Replica - Reported in the Primary Replica Report
- Time spent in sending the acknowledgement to the Primary Server over the network – NOT reported in any of the reports
- Compression Time – Time spent in compression the log block before sending to the secondary replicas. In SQL Server 2016 and above, log transport to a Synchronous secondary replica is NOT compressed, while the log transport to Async replicas is compressed.
- Local Flush Time – Avg. time spent in writing a log block to the LDF file. This value is calculated using the Log_Flush_Start and Log_Flush_Complete Extended events.
- Send Time – Time spent in sending the log block to the UCS layer in SQL. This does not include the time spent in the network layer (i.e. while in transit between the primary and secondary replicas)
Secondary Replica Latency Report
The Secondary Replica Latency information provides a breakdown of the time spent on the secondary replica during the log block transport. This report also has 3 sections as shown below.


The following values are reported by the secondary replica latency report
- Local Flush Time – Avg. time spent in writing a log block to the LDF file. This value is calculated using the Log_Flush_Start and Log_Flush_Complete Extended events.
- Decompression Time – Time spent in decompressing the log block after receiving it from the Primary. In SQL Server 2016 and above, log transport to a Synchronous secondary replica is NOT compressed, while the log transport to Async replicas is compressed.
- Receive Time – Time spent in receiving the log block from the UCS layer and enqueuing it for further processing.
- Send Time – Time spent in sending the acknowledge message to the UCS layer in SQL. This does not include the time spent in the network layer (i.e. while in transit between the primary and secondary replicas)
Note - In the sample report images above the latency is being caused by the high network roundtrip latency between the primary and the secondary replicas. This demo setup included servers in different geographies (US West and US East), with an average roundtrip latency of 25 millisecond between the two servers.
Permissions Required
The Availability Group Latency data collection feature is only enabled for sysadmin (only Windows Authenticated) accounts and requires that the current user account be an admin on all the replica instances.
Limitations and Restriction
The current implementation of the Latency data collection has the following limitations
- This functionality can only be used to collect latency data for one Availability Group at a time.
- The names for the TempDB objects used for this functionality are hardcoded. Which means only one collection can run at any time.
- Latency data is stored in TempDB tables, which means this information would be lost if the SQL Server instance has restarted since the last capture.
- The Collect Latency Data is NOT enabled for SQL Authenticated user or logins, even if the login is an admin on the server.
- Given that the functionality is only enabled for Windows Authenticated users, it will not work for Availability Group deployments in a Workgroup or in cross domain deployments where there is no trust between the domains.
- This functionality does not work for Distributed Availability Groups.
- This functionality requires the following minimum versions for SQL Server
- SQL Server 2017 RTM
- SQL Server 2016 SP1
- SQL Server 2014 SP2
Sourabh Agarwal Senior PM, SQL Server Tiger Team Twitter | LinkedIn Follow us on Twitter: @mssqltiger | Team Blog: Aka.ms/sqlserverteam
Comments
- Anonymous
December 08, 2017
What version of SQL Server is supported for this feature to work?- Anonymous
December 08, 2017
Hi, I have updated the blog to include the minimum supported versions for this functionality.
- Anonymous
- Anonymous
December 08, 2017
This looks really nice. I have run the latency collection. The Agent jobs were created and completed on both replicas. Under Reports, I don't have any standard reports. Only an option to select custom reports.- Anonymous
December 08, 2017
Hi Howard, what is the SQL Server version you are using?
- Anonymous
- Anonymous
December 08, 2017
I updated to 17.4 and was able to add the latency jobs and they run successfully. However I do not see the reports in SSMS. Do I need to do something special for them? I am using a Windows account and it is a sysadmin.- Anonymous
December 08, 2017
The server I am looking at initially is 2012.- Anonymous
December 08, 2017
Hi Brian, for now this functionality is not supported for SQL Server 2012. We are looking into the possibility of getting this to work with SQL Server 2012, but do not have an ETA on when this would be available for SQL Server 2012.
- Anonymous
- Anonymous
- Anonymous
December 09, 2017
Limitation says SQL logins are not enabled (yet), however I managed to start it during the load of the SSMS AG dashboard. Why is it disabled for SQL logins? Any technical reason behind?- Anonymous
December 11, 2017
Hi Janos, the Latency Reports makes connections to the all the AG replicas, using the current user security context (user running the AG dashboard). With SQL Logins, we cannot guarantee that the Username and Password would be the same across all replicas, hence the check to disable for SQL Logins.- Anonymous
December 13, 2017
Hi, Thanks a ton for your reply! I would add a pre-requisite in the documentation creating SQL logins in all replicas and enable in SSMS this feature :). This would be a very nice tool not just for accidental dba's. I am using a bit more sophisticated AG monitoring but this is a very nice solution.
- Anonymous
- Anonymous
- Anonymous
December 09, 2017
Great Feature!I was expecting 2012 support. I hope it would be available in the next release.- Anonymous
December 11, 2017
We are working to get this enabled for SQL Server 2012.
- Anonymous
- Anonymous
December 22, 2017
wondering how to submit a support ticket for your team ?- Anonymous
December 23, 2017
Hello Yang, if it's to report an issue with the reports, you can use the contact form in this blog. However, for product support, requests are handled by our Customer Support organization: https://support.microsoft.com/en-us/gp/support-options-for-business
- Anonymous