I don’t see Content-Encoding header in IE HTTP debugger (F12 Developer Tools)
Recently one of my colleagues came across with an interesting question. He questioned why he couldn’t see the “Content-Encoding” header in the IE HTTP debugger but was able to view it in the Fiddler.
First of all, Fiddler and IE are two different products. Their functionality should not be compared at any point of time. I will try to explain as to why we don’t see the above header in the IE HTTP debugger but we can view it in the Fiddler.
To demonstrate this, I will set-up a simple repro. I’m going to use IIS 7.5 (the latest version) to demonstrate this. Enable Compression in IIS as shown below:
Now, browse the website. For me its the default web site, so I access it over https://localhost. Hit F12 key to launch IE Developer Tools window or IE HTTP Debugger or whatever you call it. Go to the Network tab and click on “Start Capturing”.
Now Launch Fiddler, and click on Clear Cache, so that nothing is served from the cache. Now when I browse to localhost, the traffic is capture by both the IE HTTP Debugger and the Fiddler. Lets take a look at both.
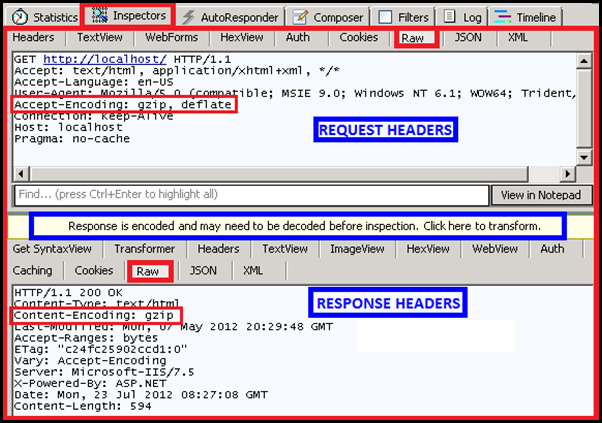
Here is the output from Fiddler:
For those of you who are not familiar with fiddler, to inspect the HTTP traffic after gathering the trace, click on the Inspectors tab as shown above. The upper portion consists of Request headers and the below portion consists of Response headers.
We can see that the Server Response contains the “Content-Encoding: gzip” header in the HTTP Response. For the readers I have also highlighted a portion of the image in blue which reads as “Response is encoded and may need to be decoded before inspection. Click here to transform”.
We will re-visit this again, but before that lets take a look at what we see in IE for the same request. Below is what we see in the IE debugger.
Select the URL which reads https://localhost and click on “Go to detailed view”. Here select “Response Headers”. You will see that the Content-Encoding header is missing. Interesting right? you will start wondering why the difference in behaviour.
Reason
The reason we don’t see the Content-Encoding header in IE because it decodes (or decompresses) the response and then reads the header values. It needs to decode the HTTP response as it needs to do this to perform Script debugging and Inspect HTML Elements and CSS Rules. (Probably it would have been better if it read the Response Headers before decoding them so that we look at the complete HTTP Response)
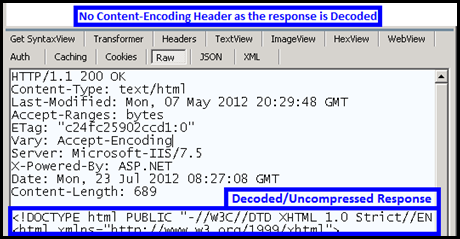
Even in fiddler, you get a option to decode the HTTP Response for the encoded responses. However, once you decode the HTTP Response (Click on “Click here to transform” in the above image), the response is encoded and the Content-Encoding header vanishes from the HTTP Response.
Response Headers in Fiddler before Decoding:
Response Headers in Fiddler after Decoding:
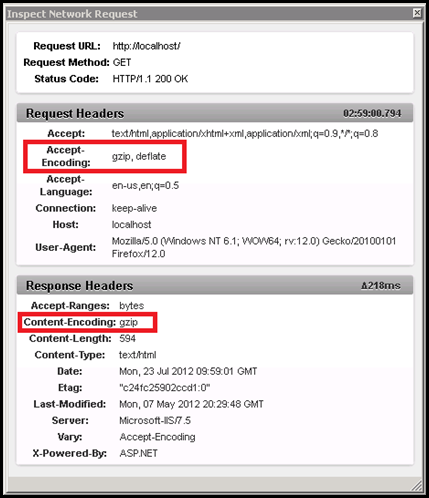
Just to Let you folks know, the debugger that comes with Firefox reads the Response headers before they are processed.
Below Snapshot is from Firefox HTTP debugger:
Some may question as to why cant IE do it. Well, these are different products and have different implementations. No one actually uses the browser for traffic monitoring, you have better tools to do so, like Network Monitor and WireShark. The HTTP debugger was designed mainly for Script Debugging and Inspection of HTML Elements.
Hopefully, the IE HTTP Debugger may become capable of reading the HTTP Response headers before they are parsed or may be it wont. The answer lies in the future.
Until then CIAO! ![]()
Comments
Anonymous
July 22, 2012
Why does IE have to do it this way? People do use browser for debugging. Firefox and Chrome give you enough to debug it directly.Anonymous
July 22, 2012
One way to look at this is that the HTTP debugger has the parsed response to look at, which should provide not major though but slight gain from Performance perspective. Well the HTTP Response is the same after encoding on all the browsers. Its the rendering part which is different. So, may be the IE group decide not to do this. On the other hand, I wish IE was capable of doing this as one may not wish to install other 3rap party tools to review the HTTP Traffic. It simplifies the task at hand if the option is in built in to the IE HTTP Debugger.Anonymous
July 22, 2012
Somehow I think although the improvements are being made on the UI front, it is not very developer friendly as such compared to other platforms.Anonymous
July 22, 2012
Is there any specific feature that you think is missing. We can take it as a feedback and maybe incorporate it in the next versions.Anonymous
July 22, 2012
Nothing specific, but look at Chrome and you would figure out how easy it is to build your plugins. IE does not provide you with any such easy to build options.Anonymous
July 22, 2012
I will agree with you on this one. :) However plugins wont be there in the near future. With HTML5 I am expecting a plugin free experience. Things should be more simpler when everything is built-in.Anonymous
September 18, 2014
It's not only about plugins, just look at the developer tools, they work much better in Chrome and Firefox.Anonymous
April 18, 2015
Yaar... encoding is fine, but why nobody confirms whether the content that came through was actually compressed and the received size is actually corresponding to the gzip compression?Anonymous
April 19, 2015
@Arun. use fiddler for that :)


