How to get a full memory dump in Azure App Services
There are a ton of blogs on getting full memory dumps but some get complicated. Note then when you create a full memory dump it will have the effect of pausing your web app so use this judiciously! Here is my simple version
Go to the Kudu site for your Azure Web App (or App Service)
You can do this from the portal for your app or simply use the azurewebsites.net url for your app and insert .scm after the name. For example:
https://problemwebapp.scm.azurewebsites.net
Find the Process ID (pid) of the process you wish to get a dump for
Navigate to the Process Explorer by clicking on the Process explorer tab at the top of the page.
You will want the pid for the w3wp.exe process (in this case 5484) that is running your code. This is NOT the SCM process. That is the process running the Kudu site. Save this PID for use below.
Note: .Net Core apps will be a sub process listed under the w3wp.exe process. Java process would be a different process as well
Go do the Debug console and capture the dump
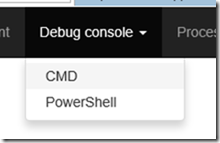
Navigate by choosing the Debug console, then CMD pull down to get to the command line interface:
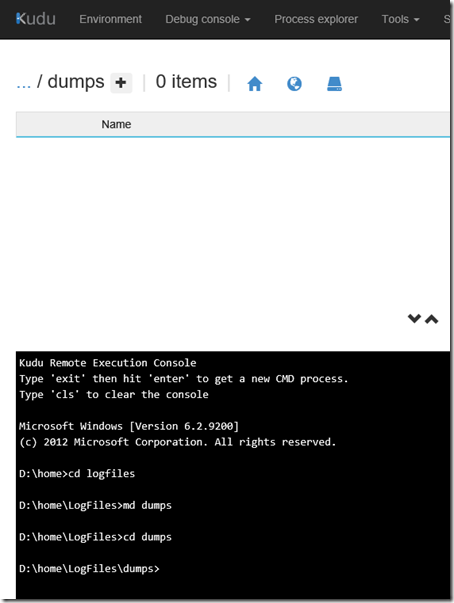
Create a directory for the dumps and navigate there as pictured below using the commands: cd logfiles, md dumps, cd dumps
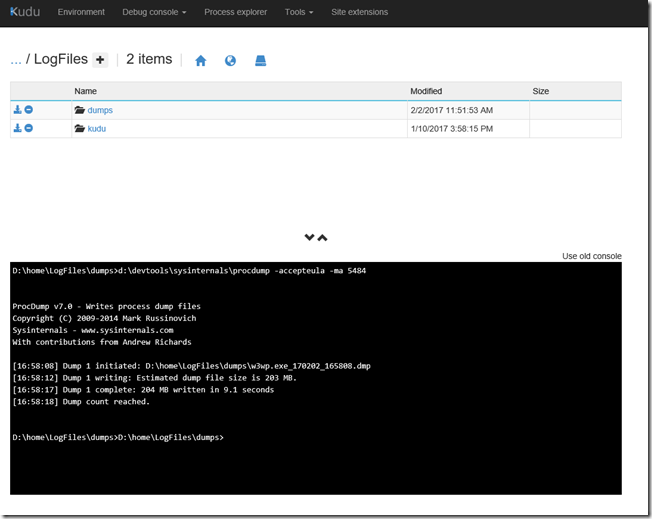
Now you can create the full memory dump with this command. The Number after the –ma is the PID you determined from above.
d:\devtools\sysinternals\procdump -accepteula -ma 5484
And this will write a dump to the current directory:
Note: You can use several different procdump commands. See this site for more options: ProcDump - technet.microsoft.com
Download Dumps for analysis
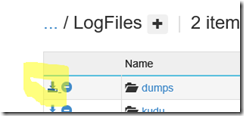
The easiest way is to navigate back to the log files directory and click on the download icon for the entire directory. This will zip that folder and download it.
You can navigate through the directory structure by clicking on the icons at the top. For instance click on the picture of the house, then the text LogFiles next to the folder icon. Click on the down load icon for the dumps directory you created the dump in.
Alternatively you can zip files using the built in tools:
d:\7zip\7za a dumps.zip w3wp.exe_170202_165808.dmp
And download the zip by navigating to it in the Debug console and using the download console, or not zip the dump at all and download it!
Analyzing the dump
By far DebugDiag is the fasted way to analyze your dump. You could also use Visual Studio.
Download Debug Diagnostic Tool v2 Update 2 from Official
Drop me a note if you thought this was useful!
Comments
- Anonymous
February 27, 2017
The comment has been removed- Anonymous
March 10, 2017
The comment has been removed
- Anonymous
- Anonymous
April 21, 2017
A good thing to add here is that when creating the dump, the w3wp process gets very slow and unresponsive (at least when there is alot of traffic to it). So if you do it on an production environment, be prepared for it to be down a few minutes (mine was affected for 4-5min when I ran this). - Anonymous
August 28, 2018
The kudu documents have been updated as well: https://github.com/projectkudu/kudu/wiki/Process-Threads-list-and-minidump-gcdump-diagsession


