Support Debugging Tool Build 13 released

As mentioned in my previous post, we needed a new build of the Support Debugging Tool for Microsoft Dynamics GP to work properly with the released build of Microsoft Dynamics GP 2010.
Releasing another build gave me the opportunity to include some enhancements that were suggested by my beta testers and the attendees at Microsoft Convergence Atlanta 2010.
The new build is now completed and available for download. I think the community will love the changes made, I know I do.
Below is a summary of the changes made for releases 9.00.0013, 10.00.0013 and 11.00.0013, I have divided them into logical sections:
Fixes
- Fixed Runtime version checks on login and for Dex.ini Settings window and Script Logging hotfix.
- Fixed Manual Logging Mode and Automatic Debugger Mode disabling active non-logging triggers.
- Fixed restoring of Toolbar colors for depressed buttons when de-activating Company Colors.
- Fixed Resource Explorer, Table Explorer, Report Explorer seeding when there is a space in the resource name.
- Change SQL Execute Tab Delimited Export to use .txt extension.
- Added User ID and Company ID into Trigger Fired message for Automatic Debugger Mode, shows on email messages sent.
Enhancements
- Added Clear Button to the Security Profiler Window.
- Added MBS_Debug_ShowRuntime Dex.ini setting to control access to Runtime Engine resources.
- Added support to Resource Explorer, Table Explorer, Report Explorer to reference Runtime Engine.
- Added support for Automatic Debugger Mode triggers and Runtime Execute scripts to reference Runtime Engine.
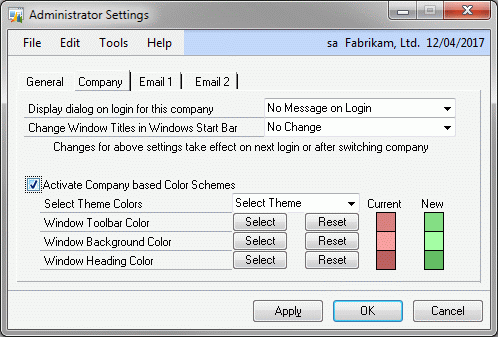
- Improved Company Color Settings depending on version of Microsoft Dynamics GP.
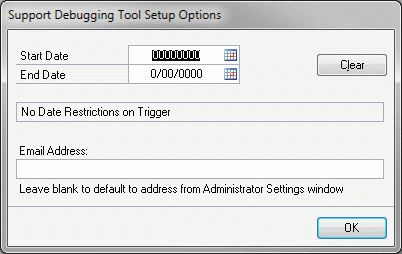
- Added Email Address field to Options window of Automatic Debugger Mode Setup window which can be used to override the default Administrator email address.

Performance
- Added smarter form opening and closing logic to Resource Explorer to prevent it being closed while still being used by another form.
- Performance enhancements when opening windows and starting and stopping logging modes.
Usability
- Added memory to Resource Information window; Resource Type, Search Mode and Case Sensitive fields.
- Added feature to remember current location when changing views to show or hide missing and hidden resources in the Resource Explorer and Menu Explorer windows.
- Added window position memory to the main Support Debugging Tool window.
- Added All Dictionary modes to tree for the Resource Explorer, Table Explorer and Report Explorer windows.
- Added Dictionary and Series information to the right hand panes of the Resource Explorer, Table Explorer, Menu Explorer and Report Explorer windows.
- Added Table Group Display and Technical names to right hand pane of the Table Explorer window.
- Added Export to tab delimited, comma delimited or html from the Resource Explorer, Table Explorer, Menu Explorer and Report Explorer windows.
Features
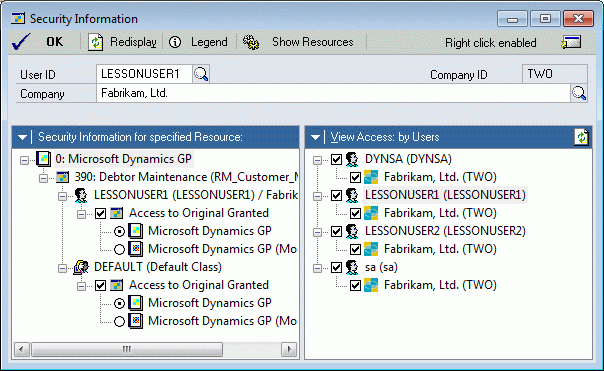
- Added Resource Selection via Resource Explorer to Security Information window.

- Added security check to Security Information window to ensure user has access to Security Setup windows.
- Added Security Information window to Options menu and Debugger Menu to allow window to be opened directly by user.
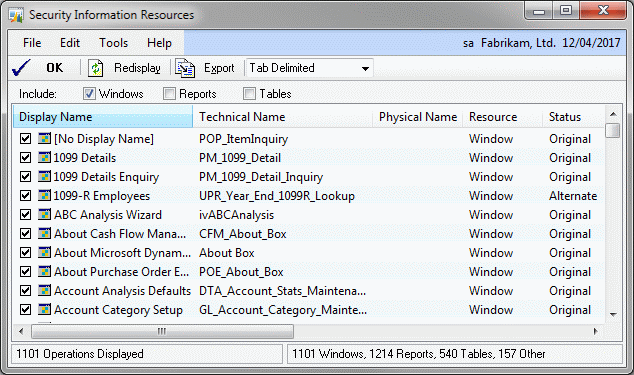
- Added Security Information Resource window to show security information down to resource level.

- Added Theme Selection for Company Color coding feature with 16 themes.

- Added Raise All Windows feature to the Application Menu (v10.00 or later).
Acknowledgments
Thanks to Mariano Gomez and Leslie Vail who came up with the Company Color Themes and the Security Information Resource window ideas (respectively).
Downloads
For downloads, please see the Support Debugging Tool Portal Page:
Support Information
The Support Debugging Tool is a custom built tool to provide additional capabilities to troubleshoot issues and is not part of the standard Microsoft Dynamics GP released application. Technical support for this tool is not handled via the standard support systems and instead is provided via the public Microsoft Dynamics GP Community Forum. You can use the link below to access the forum:
To assist the partners and Microsoft employees who monitor the forum for these questions, please prefix any subject lines with the initials "SDT: ".
More Information
For more information, please see the Support Debugging Tool Portal Page:
Please post your feedback on what you think of this build and what you would like to see in the future.
David
16-May-2013: Updated More Information and Downloads to link to Support Debugging Tool Portal page.
Comments
Anonymous
May 13, 2010
Posting from DynamicAccounting.net http://msdynamicsgp.blogspot.com/2010/05/support-debugging-tool-build-13.htmlAnonymous
May 14, 2010
Posting from Inside Dynamics GP Blog http://blogs.msdn.com/gp/archive/2010/05/14/new-support-debugging-tool.aspx Thanks PamAnonymous
May 24, 2010
Posting from Victoria Yudin http://victoriayudin.com/2010/05/17/support-debugging-tool-new-build-released/Anonymous
May 25, 2010
Posting from DynamicAccounting.net msdynamicsgp.blogspot.com/.../dynamics-gp-2010-excel-based-table.html Thanks Mark, good to see you using the Support Debugging Tool.Anonymous
June 15, 2010
The comment has been removedAnonymous
June 16, 2010
The comment has been removedAnonymous
July 25, 2010
Posting from Victoria Yudin victoriayudin.com/.../new-resource-to-find-dynamics-gp-table-and-field-information