VS2010: Investigating a sample profiling report (Function Details)
I’ve already discussed how the new profiler summary page makes it easier to discover and fix performance issues, but sometimes a little more investigation is required. This time I’m going to drill in with another new VS2010 feature called the Function Details View.
I’m going to use PeopleTrax application again, which you can download from CodeBox. I have a report which I collected earlier using the Sampling method of profiling, since the application appears to be CPU bound (at least on a single core).
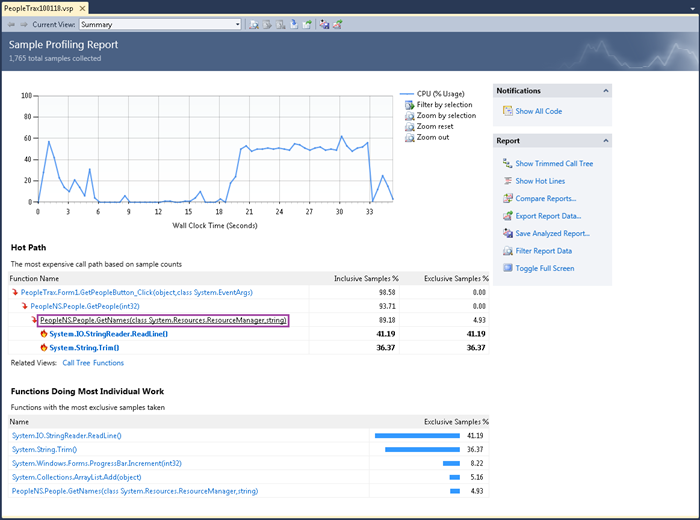
In this report I take a look at the Hot Path and see that People.GetNames is calling two hot functions ‘StringReader.ReadLine()’ and ‘String.Trim()’.
I’d like to see where these expensive calls are in my code so I click on GetNames (shown in purple above) to bring up the new Function Details view.
There are a few things to note about this new view.
- The title at the top is for People.GetNames().
- There is a dropdown to switch between ‘Inclusive Samples %’ and ‘Inclusive Samples’
- There are some blue boxes showing callers and callees (I’ll cover this more later).
- The code is shown with hot lines and an annotated margin.
In the default view we would need to drag the splitter (shown in purple) to see all of the boxes. Instead, we can use the toolbar option to ‘Split Screen Vertically’, also highlighted in purple.
Now we can clearly see where the calls to ReadLine() and Trim() are in the code on the right-hand side. There is also a metrics table in the ‘Function Performance Details’ section and there are some related links.
At this point, let’s look at the blue boxes. The left-hand box shows the callers of this function. The height of the box represents the relative cost for the metric that is currently chosen (in this case Inclusive Samples). Since we have a single caller, it takes up the entire box.
On the right we have another blue box that contains several sections:
- Function Body (87 samples). The height of this box represents the relative number of samples in the body itself (Exclusive Samples).
- ReadLine (727 samples). This is the function with the most Inclusive Samples. Again, the height is proportional so it is also the biggest box.
- Trim (642 samples). The function with the second most Inclusive Samples. Slightly smaller height.
- Other functions with smaller sample counts.
Each of these boxes (aside from Function Body) is clickable, allowing navigation of the Caller/Callees.
Looking at the code I can’t see an easy way to simplify it and I don’t control either Trim() or ReadLine(), so now let’s navigate one level up in the callers by clicking on GetPeople.
Clicking causes us to navigate to the GetPeople Function Details view:
From the code on the right-hand side we can see that in the two highlighted calls to GetNames 89.2% of the samples are occurring. From the loop structure it seems like it would be a good idea to avoid making these GetNames calls inside the for loop. Followers of the PeopleTrax application will notice that this is the first optimization suggestion for this application – cache the GetNames calls in the constructor. The next step in this investigation would be to change the code, collect another profile and compare the reports, but I’ll leave that up to you.
NOTE: line-level information is only available for sample-profiling. Since this information is not available in Instrumentation mode, highlighting and margin annotation is also not available for Instrumentation mode.


