Step-by-Step: Enable Diagnostics on an Azure Virtual Machine
Hello folks,
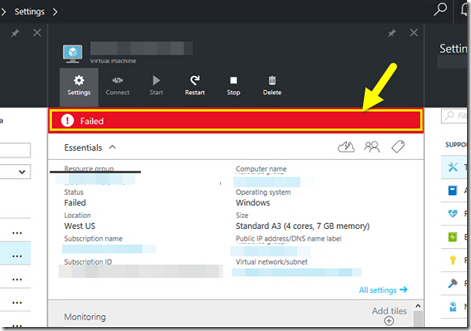
Last week I was talkin g with a customer about a VM that was having some issues. We did not know exactly what was going on with this machine but something the portal kept providing us with some errors. (the particulars of this machine are blurred since this is production). We’re still troubleshooting that particylar problem but it brought up to the surface the need to be able to troubleshoot a VM even if it’s running in the cloud.
The bottom line is that we need to keep track of the health of our infrastructure. We discussed it almost a year ago. Today let’s look at who we setup support debugging features in ARM through the portal. The diagnostics will allow us to collect the following:
- Basic metrics
- Network metrics
- .NET metrics
- ASP.NET metrics
- SQL metrics
- Windows event system logs
- Windows event security logs
- Windows event application logs
- Diagnostics infrastructure logs
- IIS logs
- Boot diagnostics
The Windows Logs can include All the entries or be filtered by type such as Information, Warning, Error and Critical. That way if a VM won’t boot, or crashes we can follow the bread crumbs and figure out why in a similar manner we would with a physical machines. Look at the logs…
Setting up diagnostic with a new VM
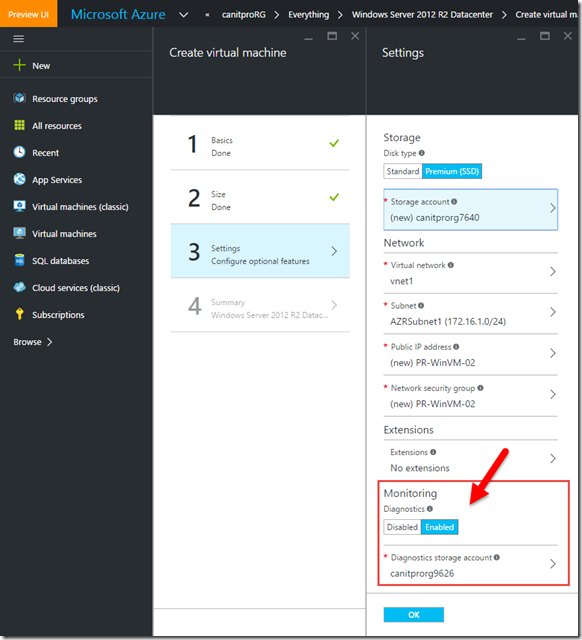
When creating a new Virtual Machine portal, after you selected the Azure Resource Manager from the deployment model dropdown, and configured the basic settings and the size of a VM. You need to insure that the monitoring option is enabled and that you have selected a storage account where you would like to place these diagnostic files.
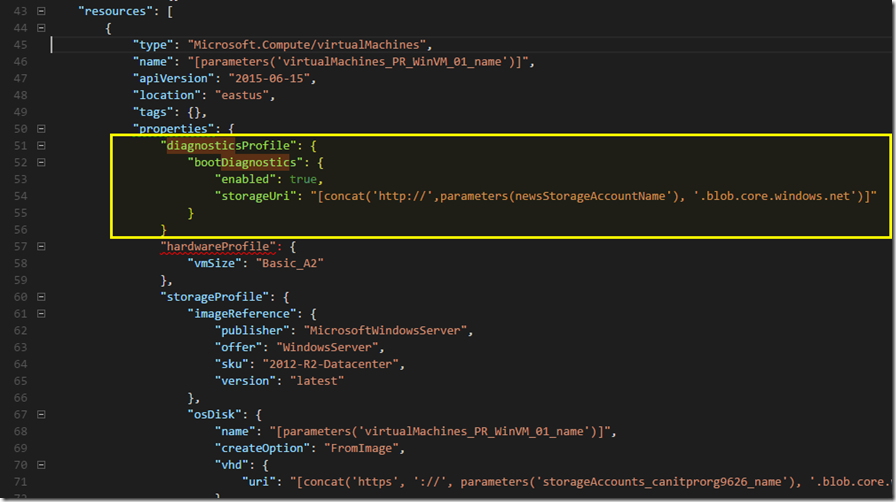
If you are using a Azure Resource Manager template, find your Virtual Machine resource and add a diagnostics profile section where you will identify the status or the diagnostic (enabled=True/False) and where to store the log files ( "storageUri": "[concat(' https://',parameters(newsStorageAccountName') , '.blob.core.windows.net')]" ). Remember to use the “2015-06-15” API version header
you can than deploy the VM normally. and the diagnostic will be turned on.
Update an Existing Virtual Machine
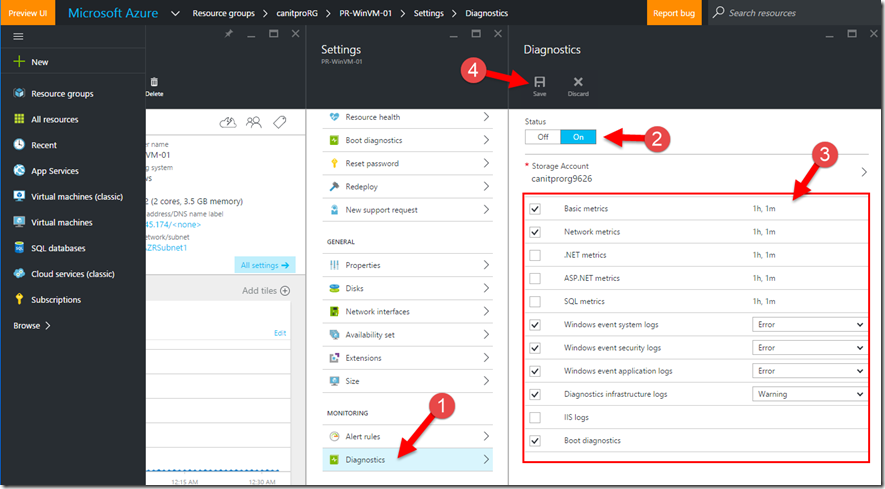
You can also update an existing ARM based Virtual Machine through the Portal to enable diagnostics. Navigate to your VM and select “Diagnostics” (1) in the settings blade. Enable the Status (2) and select the level of diagnostics you want to collect (3) and save your settings.
Remember that you must restart the VM for the changes to take effect.
View Logs
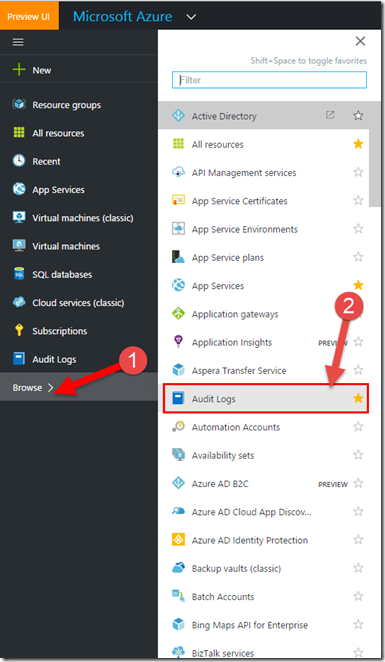
to view the logs, in the portal select “Browse” and select “Audit Logs” to see all the event logs you have configured.
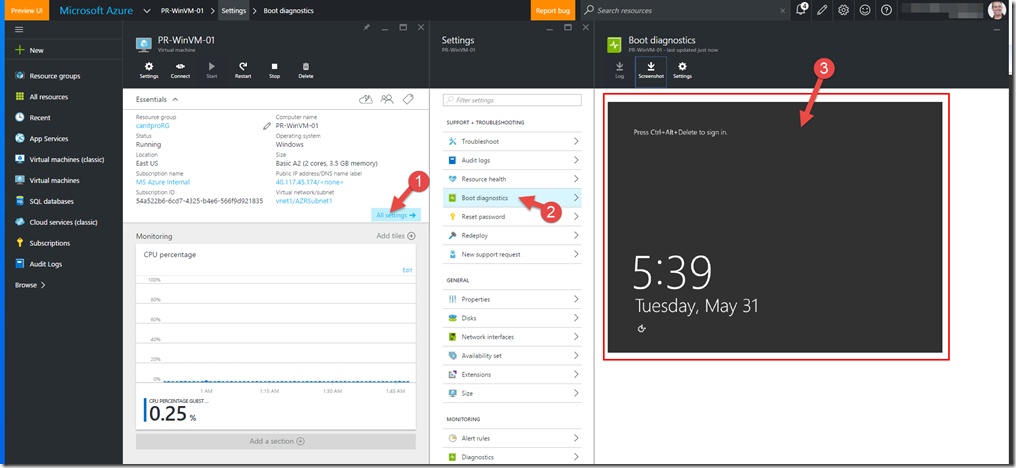
And for the “Boot Diagnostics”, In the portal navigate to your virtual machine and in the “settings” blade and select “Boot Diagnostics”. This will give you access to the screenshot for the boot process,
I hope this helps.
Cheers!
Pierre Roman
@pierreroman
