Exemple de scénario de scripts Office : extraire et graphe les données de niveau d’eau à partir de la NOAA
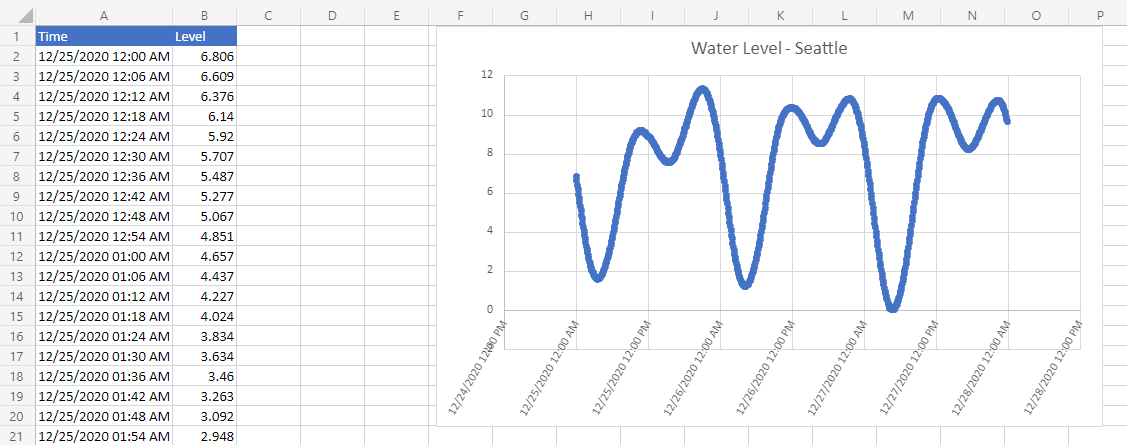
Dans ce scénario, vous devez tracer le niveau de l’eau à la station de Seattle de la National Oceanic and Atmospheric Administration. Vous allez utiliser des données externes pour remplir une feuille de calcul et créer un graphique.
Vous allez développer un script qui utilise la fetch commande pour interroger la base de données Tides and Currents de la NOAA. Cela permettra d’enregistrer le niveau d’eau sur un intervalle de temps donné. Les informations étant retournées au format JSON, une partie du script les traduit en valeurs de plage. Une fois que les données sont dans la feuille de calcul, elles sont utilisées pour créer un graphique.
Pour plus d’informations sur l’utilisation de JSON, consultez Utiliser JSON pour passer des données vers et à partir de scripts Office.
Compétences en écriture de scripts couvertes
- Appels d’API externes (
fetch) - Analyse JSON
- Graphiques
Instructions d’installation
Ouvrez le classeur dans Excel.
Sous l’onglet Automatiser , sélectionnez Nouveau script et collez le script suivant dans l’éditeur.
/**
 * Gets data from the National Oceanic and Atmospheric Administration's Tides and Currents database.
 * That data is used to make a chart.
 */
async function main(workbook: ExcelScript.Workbook) {
  // Get the current sheet.
  let currentSheet = workbook.getActiveWorksheet();

  // Create selection of parameters for the fetch URL.
  // More information on the NOAA APIs is found here:
  // https://api.tidesandcurrents.noaa.gov/api/prod/
  const option = "water_level";
  const startDate = "20201225"; /* yyyymmdd date format */
  const endDate = "20201227";
  const station = "9447130"; /* Seattle */

  // Construct the URL for the fetch call.
  const strQuery = `https://api.tidesandcurrents.noaa.gov/api/prod/datagetter?product=${option}&begin_date=${startDate}&end_date=${endDate}&datum=MLLW&station=${station}&units=english&time_zone=gmt&application=NOS.COOPS.TAC.WL&format=json`;

  console.log(strQuery);

  // Resolve the Promises returned by the fetch operation.
  const response = await fetch(strQuery);
  const rawJson: string = await response.json();

  // Translate the raw JSON into a usable state.
  const stringifiedJson = JSON.stringify(rawJson);

  // Note that we're only taking the data part of the JSON and excluding the metadata.
  const noaaData: NOAAData[] = JSON.parse(stringifiedJson).data;

  // Create table headers and format them to stand out.
  let headers = [["Time", "Level"]];
  let headerRange = currentSheet.getRange("A1:B1");
  headerRange.setValues(headers);
  headerRange.getFormat().getFill().setColor("#4472C4");
  headerRange.getFormat().getFont().setColor("white");

  // Insert all the data in rows from JSON.
  let noaaDataCount = noaaData.length;
  let dataToEnter = [[], []]
  for (let i = 0; i < noaaDataCount; i++) {
    let currentDataPiece = noaaData[i];
    dataToEnter[i] = [currentDataPiece.t, currentDataPiece.v];
  }

  let dataRange = currentSheet.getRange("A2:B" + String(noaaDataCount + 1)); /* +1 to account for the title row */
  dataRange.setValues(dataToEnter);

  // Format the "Time" column for timestamps.
  dataRange.getColumn(0).setNumberFormatLocal("[$-en-US]mm/dd/yyyy hh:mm AM/PM;@");

  // Create and format a chart with the level data.
  let chart = currentSheet.addChart(ExcelScript.ChartType.xyscatterSmooth, dataRange);
  chart.getTitle().setText("Water Level - Seattle");
  chart.setTop(0);
  chart.setLeft(300);
  chart.setWidth(500);
  chart.setHeight(300);
  chart.getAxes().getValueAxis().setShowDisplayUnitLabel(false);
  chart.getAxes().getCategoryAxis().setTextOrientation(60);
  chart.getLegend().setVisible(false);

  // Add a comment with the data attribution.
  currentSheet.addComment(
    "A1",
    `This data was taken from the National Oceanic and Atmospheric Administration's Tides and Currents database on ${new Date(Date.now())}.`
  );

  /**
   * An interface to wrap the parts of the JSON we need.
   * These properties must match the names used in the JSON.
   */
  interface NOAAData {
    t: string; // Time
    v: number; // Level
  }
}
Renommez le script en Graphique de niveau d’eau NOAA et enregistrez-le.
Exécution du script
Dans n’importe quelle feuille de calcul, exécutez le script NoAA Water Level Chart . Le script extrait les données de niveau d’eau du 25 décembre 2020 au 27 décembre 2020. Les const variables au début du script peuvent être modifiées pour utiliser des dates différentes ou obtenir des informations de station différentes. L’API co-OPS pour la récupération de données décrit comment obtenir toutes ces données.
Après l’exécution du script
