VM metrics
VM metrics provide unique insights about the Virtual Machines (VMs) resources that are created as part of the PlayFab VM Builds when you're using PlayFab Multiplayer Servers to create multiplayer game servers. This feature provides you access to the virtual machine's system level metrics such as CPU, RAM, and more. With these metrics, you can make informed decision about maximizing your utilization of the VM resources.
Performance metrics can support various development scenarios.
- Use CPU and memory utilization data to measure the resource needs of multiplayer servers, so you can properly calculate the optimal number of game servers on a specific Virtual Machine SKU (type)
- Use network counters to detect an irregular network environment, such as attempted DDoS attacks or other network congestion
PlayFab Multiplayer Servers service supports a limited number of system metrics via the VM Metrics feature.
Usage
VM metrics for a Build can be enabled in two ways, depending on how a Build is created:
- Using Game Manager, you can enable the "Virtual machine metrics" checkbox on the "New Build" Game Manager page.
- Using the PlayFab Multiplayer Servers API, you can set the property IsEnabled to TRUE in the following API objects.
- InstrumentationConfiguration in the CreateBuildWithManagedContainer API call for a Windows Build with containers
- InstrumentationConfiguration in the CreateBuildWithProcessBasedServer API call for a process-based Windows Build
- LinuxInstrumentationConfiguration in the CreateBuildWithCustomContainer API call for a Linux Build
When VM metrics feature is enabled for a Build, it will remain enabled for the entire lifetime of the Build. You can't enable/disable VM metrics for a Build after it has been created.
Windows
On Windows, VM metrics collection is a feature of the existing PlayFab container/process orchestrator called VmAgent. VmAgent periodically (every 10 seconds) runs a task that will query the following system performance counters.
- Available MBytes
- % Processor Time
- % User Time
- Disk Reads/sec (for drive D:)
- Disk Writes/sec (for drive D:)
- Bytes Received/sec
- Bytes Sent/sec
Collected counter values are sent to our internal metrics collector running on the VM. The collector aggregates and sends them to our internal backend so they can be presented to the user on Game Manager.
Linux
On Linux, we're using the open-source telegraf agent for collecting and processing metrics. Telegraf collects metrics every 10 seconds and emits them to our internal collector agent every 60 seconds. For reference, you can see the contents of the telegraf.conf configuration file we're using below. For more details, go to the official telegraf docs.
We're also using an internal utility called telegraf-geneva-processor that emits the diff value for counter level metrics like the net_bytes_recv metric. Emitting the diff value instead of the actual counter value results in better visualization in the provided Game Manager graphs.
[agent]
  interval = "10s"
  round_interval = true
  metric_batch_size = 1000
  metric_buffer_limit = 10000
  collection_jitter = "0s"
  flush_interval = "60s"
  flush_jitter = "0s"
  precision = ""
  debug = false
  omit_hostname = true

[global_tags]
  titleID = "TITLE_ID"
  buildID = "BUILD_ID"
  vmID = "VM_ID"

# consult man proc for details
# https://github.com/influxdata/telegraf/tree/master/plugins/inputs/cpu
[[inputs.cpu]]
  percpu = false
  totalcpu = true
  name_prefix = "telegraf_"
  fieldpass = ["usage_system", "usage_user"]

[[inputs.mem]] # https://www.linuxatemyram.com/
  fieldpass = ["available_percent"]
  name_prefix = "telegraf_"

[[inputs.net]] # /proc/net/dev
  fieldpass = ["bytes_sent", "bytes_recv"]
  name_prefix = "telegraf_"
  interfaces = ["eth0"]
  tagexclude = ["interface"]

# https://github.com/influxdata/telegraf/tree/master/plugins/inputs/diskio
[[inputs.diskio]] # /proc/diskstats
  fieldpass = ["reads", "writes"] # number of reads and writes on sdb device
  devices = ["sdb"] # sdb device contains everything (including container storage) apart from /mnt
  name_prefix = "telegraf_" # which is the place where some of our shared folders are

# grab the allocated percentage from VmAgent. Be aware that this must be in influx format
[[inputs.http]]
  urls = ["http://localhost:56001/v1/metrics/allocatedpercentage"]
  name_prefix = "telegraf_"
  data_format = "influx"
  tagexclude = ["url"]

# send all telegraf data to internal collector
[[outputs.socket_writer]]
  address = "unix:///var/etw/mdm_influxdb.socket"
  data_format = "influx"

# write this data to a file. This might be removed in the future
[[outputs.file]]
  files = ["/tmp/PerformanceMetrics.csv"]
  data_format = "influx"
  rotation_max_size = "100MB"
  rotation_max_archives = 5

[[processors.execd]]
  command = [
    "/usr/bin/telegraf-geneva-processor",
    "-configFile=/etc/telegraf/telegraf.geneva.processor.conf"
  ]
This telegraf.conf configuration enables the telegraf agent to collect the below metrics:
- cpu_usage_system
- cpu_usage_user
- memory_available_percent
- net_bytes_recv_diff (network bytes received for eth0)
- net_bytes_sent_diff (network bytes sent for eth0)
- diskio_reads_diff (number of reads for sdb)
- diskio_writes_diff (number of writes for sdb)
Similar to Windows, telegraf sends the collected counter values to our internal metrics collector. The collector aggregates and sends these values to our internal backend so they can be presented to the user on Game Manager.
Allocation Percentage
In both Windows and Linux VMs, we're emitting a metric called Allocation Percentage. The value of this metric is calculated by dividing the number of Active servers with the Total number of servers on the VM. This metric is meant to be used when evaluating and interpreting the reported system metric values. This is because the value of the system metrics will probably be different on a VM with lots of Active servers compared to a VM with lots of StandingBy servers.
Viewing VM metrics
When you enable the VM metrics feature for a new Build, metrics will be emitted as soon as the Build is successfully deployed. You can use the "Virtual Machines" (https://developer.playfab.com/en-US/<YOUR_TITLE_ID>/multiplayer/server/virtual-machines) page on Game Manager to get a link to display VM metrics for a specified VM.
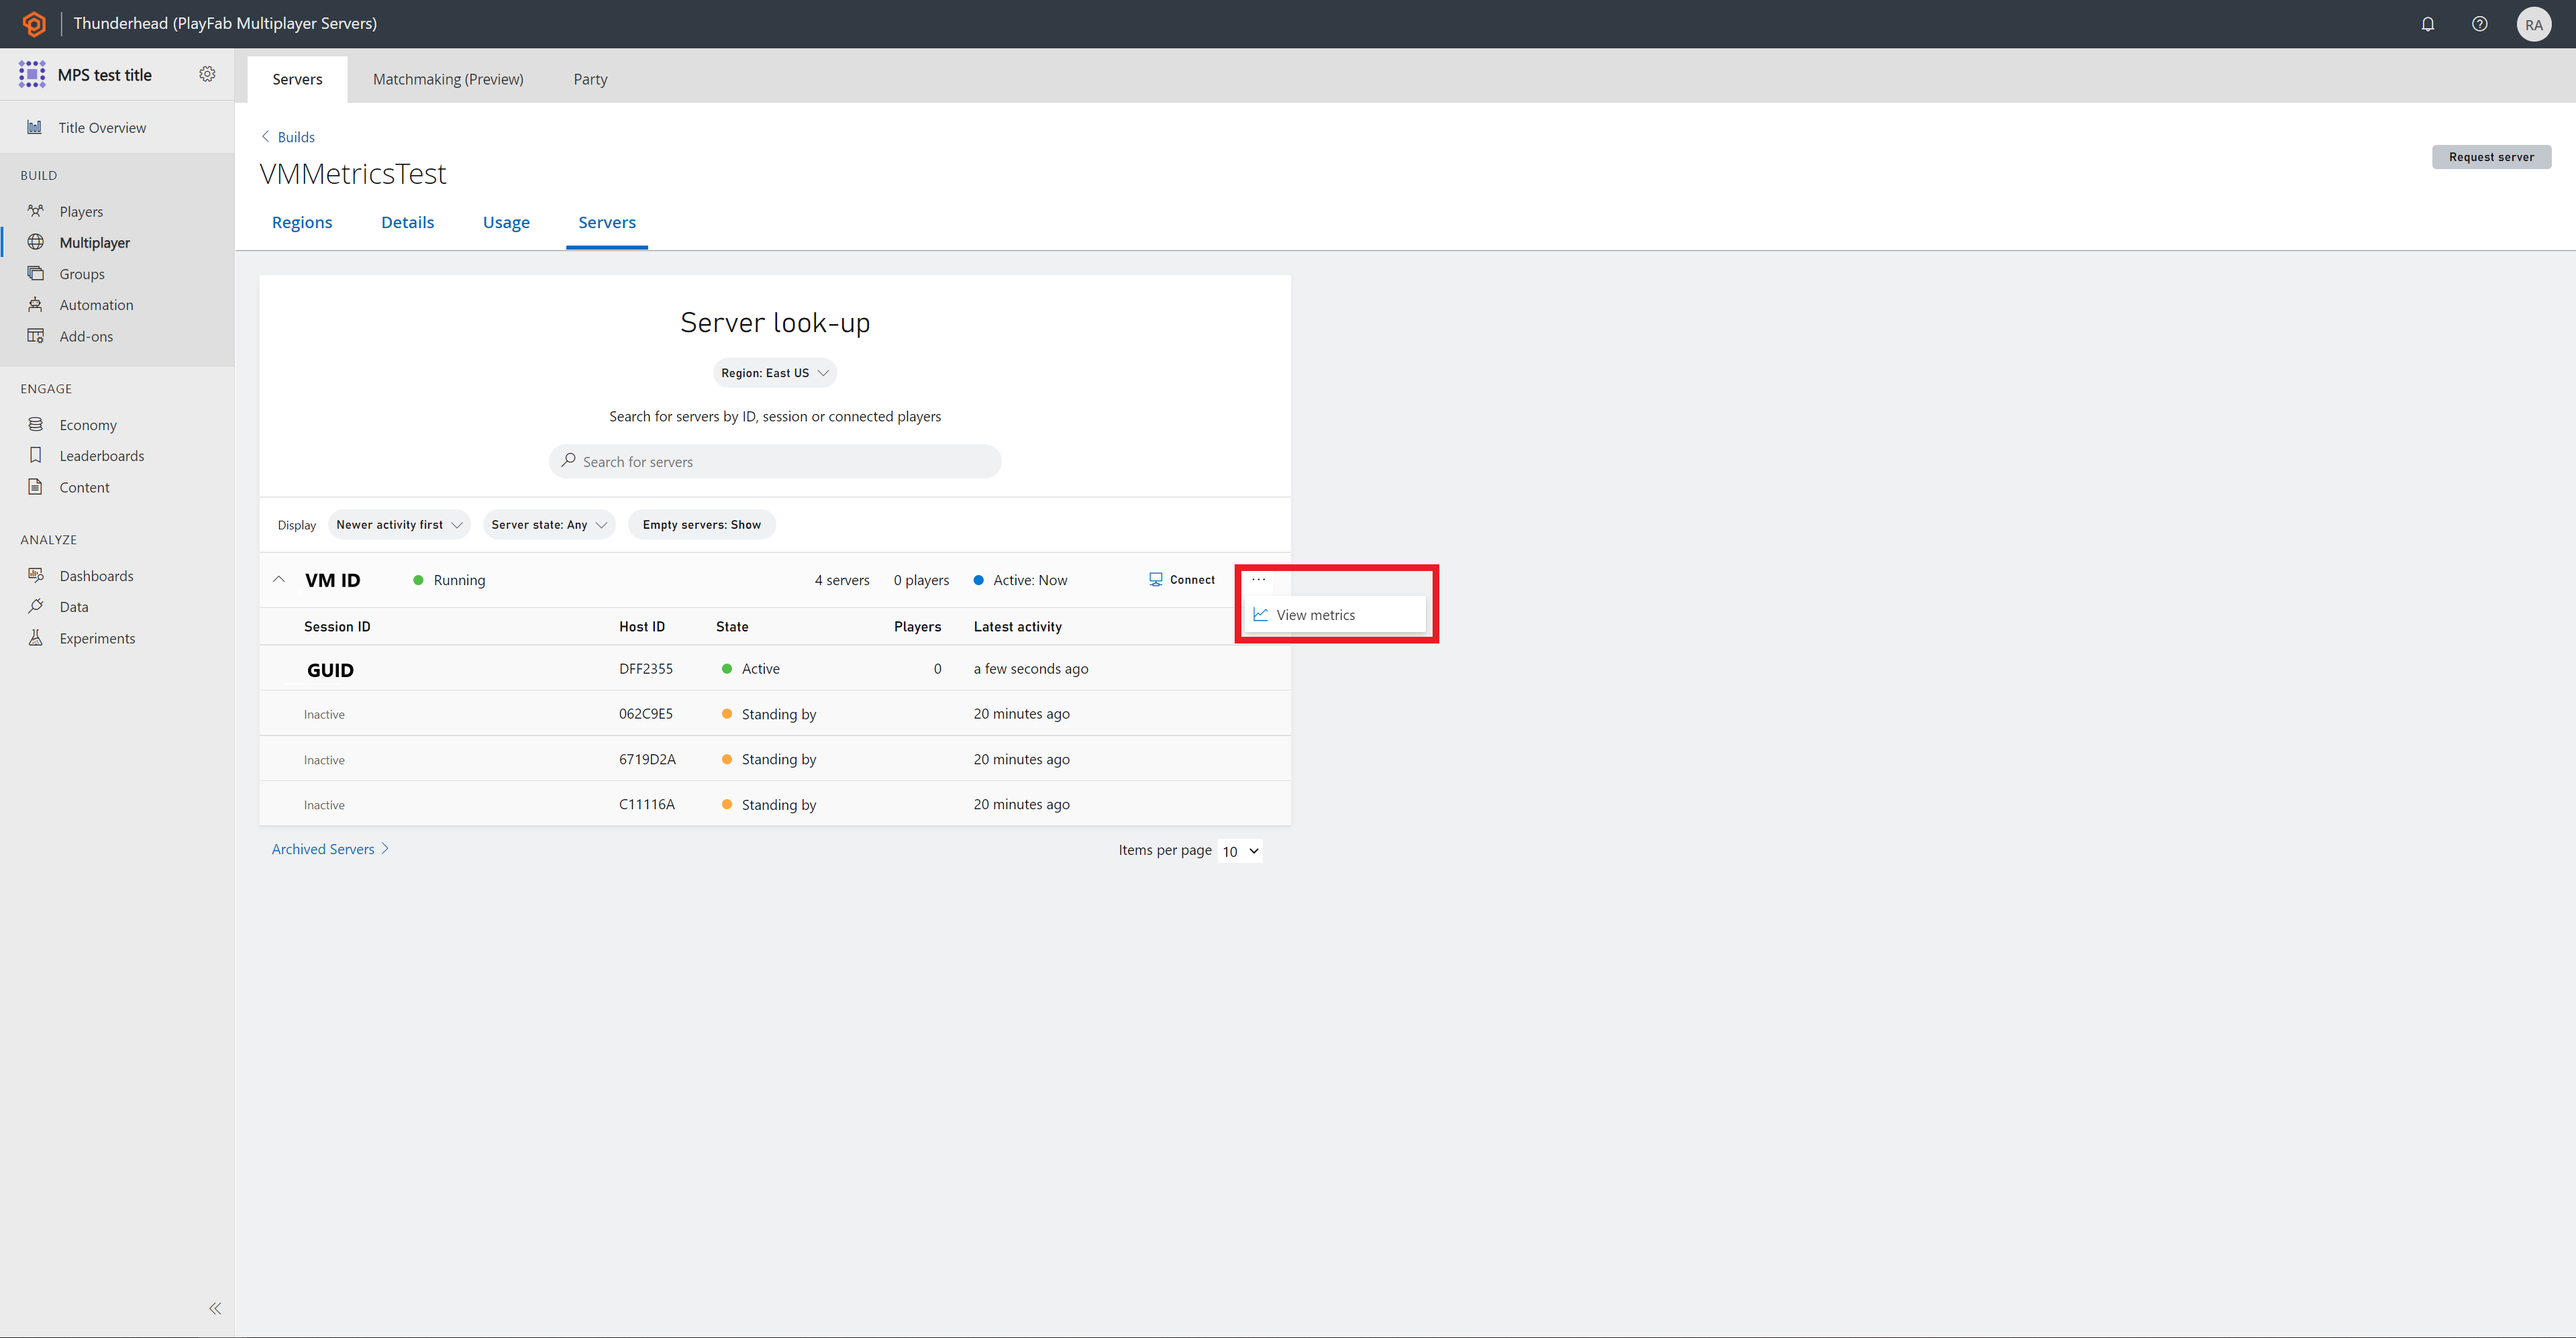
You can also access the VM metrics by selecting your build, going to the servers tab, and hitting the menu inline with the VM you would like to see the metrics on, and select "View Metrics"

How can I submit feedback for this feature?
Join us on Discord on the #multiplayer-servers channel, we would love to get in touch and hear your thoughts about this feature!