Google Analytics Dashboard
Note
- To Start using Clarity, you must finish the Setup process.
- To start using Google Analytics Dashboard, you must connect your Google Analytics account. Learn more about Google Analytics integration.
Google Analytics (GA) Dashboard in Clarity helps you analyze GA data through Clarity features. Without leaving the site, you can now easily use Clarity's exclusive features, such as Recordings and Heatmaps on GA data.
You don't need to worry about translating GA data to fit into Clarity filters. While GA provides exciting data on user behavior, Clarity can help you understand and enhance user behavior.
To access the GA dashboard, go to your project. Select Dashboards -> Google Analytics button.
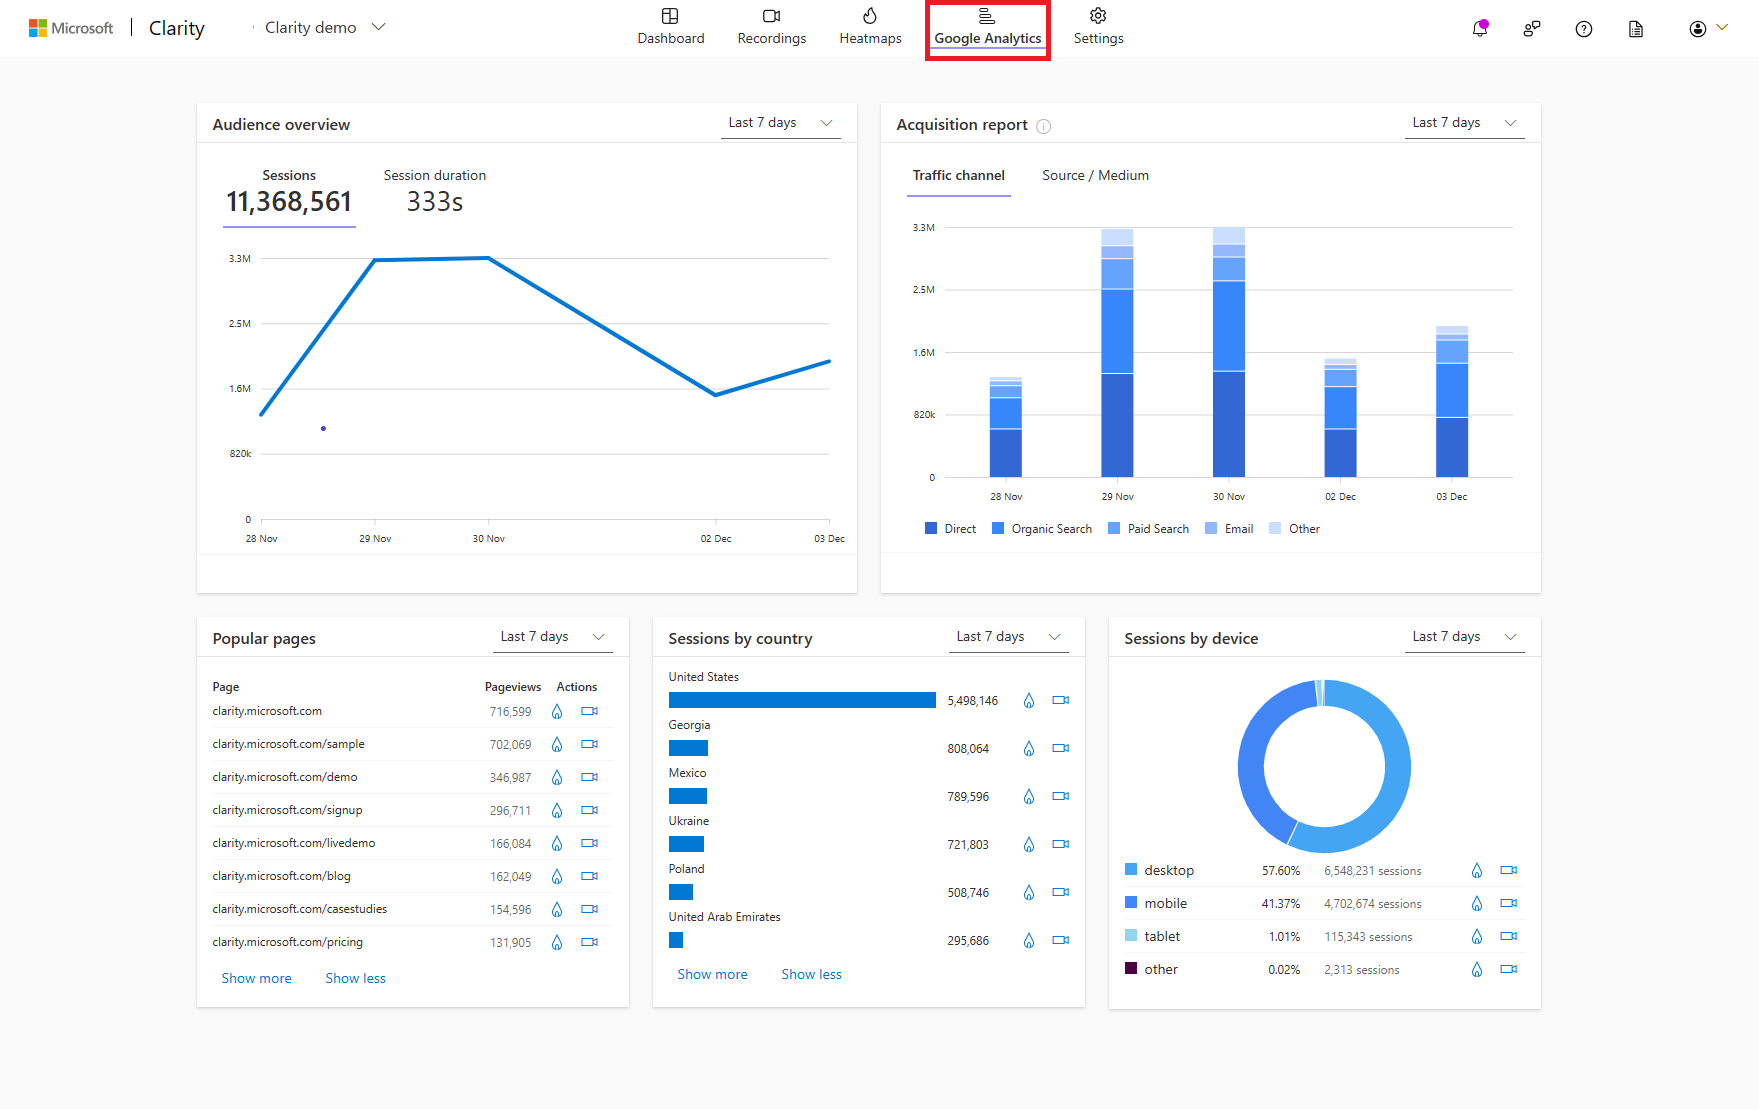
What's in the GA dashboard?
At a glance, you can see the number of sessions from each country/region and device, acquisition report, and so on.
The dashboard contains the following information:
These metrics can be filtered to a particular time period, which allows you to drill down on user behavior patterns.
Note
- The GA dashboard doesn't support filters or segments. You can only access the time frame filter on individual cards.
- As you navigate through each of these metrics, you can view the corresponding Heatmaps or Recordings filtered to the applied time frame.
- You can save this applied filter in Heatmaps or Recordings as a new segment for later use.
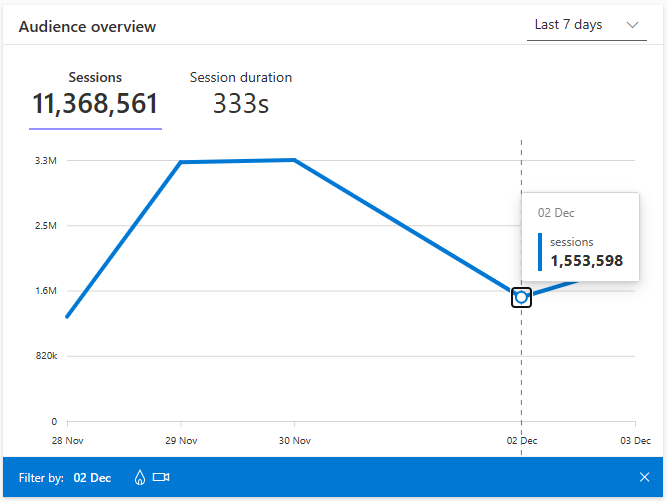
Audience overview
Audience overview measures the volume of visits to your site. This overview provides the total number of sessions and session duration for the specified time frame. Learn more about Clarity's Session filters. Using these data points, you can:
- Find sessions that are most significant on your website, such as those during a usage spike.
- Investigate where users come across an issue.
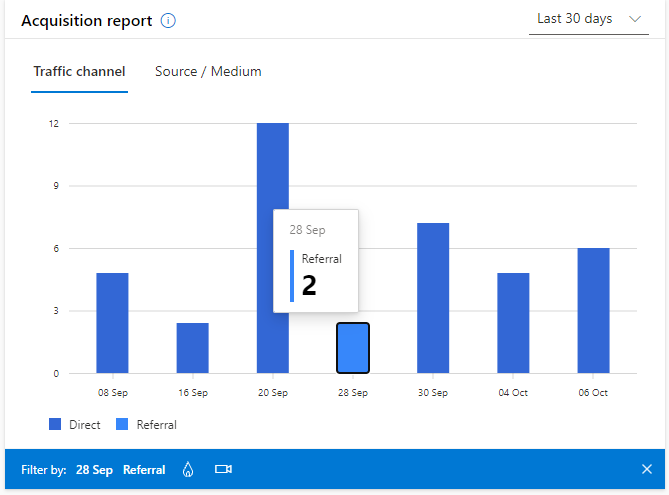
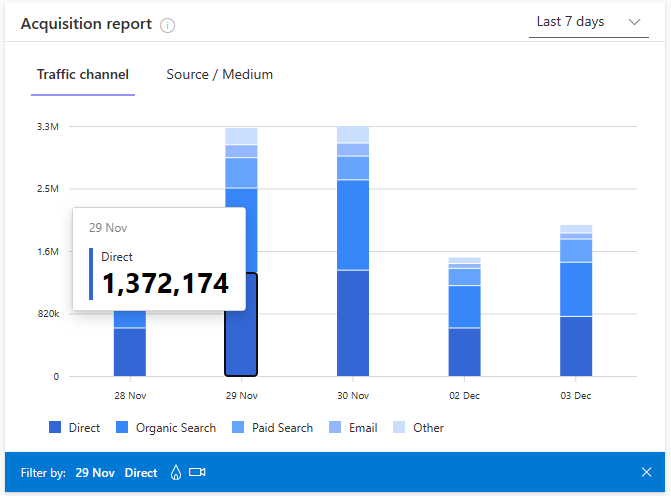
Acquisition report
Acquisition report helps you view how you acquire your users that including Traffic channel and Source/Medium. This report can help you with direct comparisons and diagnose issues and optimize performance. Learn more about Clarity's Traffic filters. Using these data points, you can:
- Break down your traffic based on source, medium, and channel.
- Find the direct or referral traffic channel or source/medium to your website.
Popular pages
Pages report helps you find popular pages sorted based on page views from highest to lowest. A page view can include an initial loading of the page, reload, and page revisit. Learn more about Clarity's Pages filters. Using these data points, you can:
- Find interesting user content and optimize your website.
- Track page views for new web pages and understands user response.
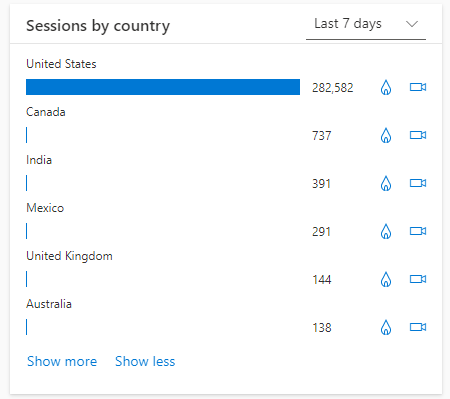
Sessions by country/region
Sessions by country/region enable you to view sessions based on country/region sorted from high to low.
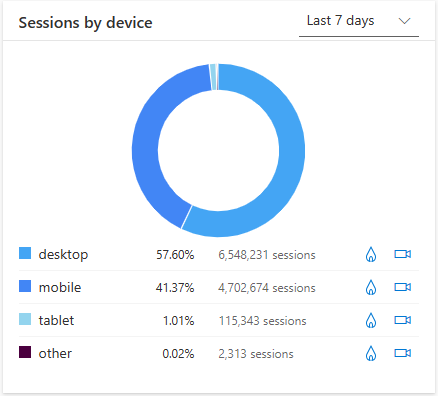
Sessions by device
Sessions by devices enable you to view sessions based on device type sorted from high to low.
FAQ
For more answers, refer to the GA Dashboard FAQ.