Azure Mobile Apps – Contoso Health Demo App that Integrates with Azure Machine Learning and Power BI
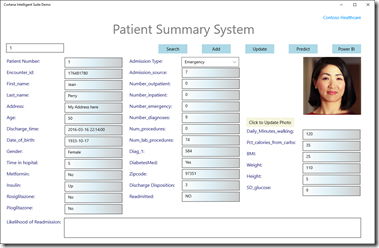
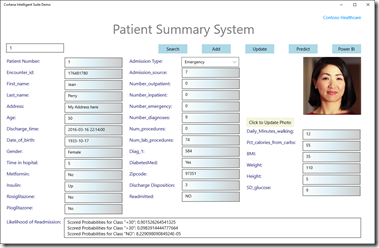
I recently worked with the Cortana Intelligent Suite Ecosystem team to create a demo app called Contoso Health while preparing for a healthcare partner meeting. The motivation behind the demo app is to show how we can use Azure Machine Learning web services and Power BI in a “real” demo application, real in terms of the amount of data. The use case is to perform a what-if analysis of or predication on how likely or unlikely a patient will be readmitted to the hospital within or after 30 days after discharge based on the patient data such as weight (BMI), dietary habit (calories from carbohydrates) and life style (daily walking minutes). You can find the source code at GitHub.
High-level Architecture
The front end - Windows 10 Universal Windows Platform app developed in Visual Studio 2015 Update 2. In addition, two Microsoft Power BI pages are created with the free Power BI Desktop tool, which uses the Spark ODBC driver to access data stored in Spark tables.
Middle Tier – Web API based on Mobile Apps in Azure App Service. The web service that predicts a patient's readmission rate is based on Machine Learning. Both services are hosted on Azure.
Backend data – Patient data (one table only) is stored in Azure SQL Database while other data is stored in Azure Storage. Azure Data Factory (ADF) is used to aggregate and denormalize the data. While you can use the Azure portal to create ADF linked services and pipelines, you can also use Microsoft Azure DataFactory Tools for Visual Studio 2015.
- 101,766 rows of patient records data
- 4,493,555 rows of grocery shopping data
- 166,852,080 rows of glucose sensor data
- 5,542,352,640 rows of vital sensor data
The Power Behind Azure Machine Learning Model
The patient’s readmission probability changes from “No” to “90.15%” of readmission within 30 days when walking minutes changed from 120 to 12, calories from 35 to 55, and BMI from 25 to 35.
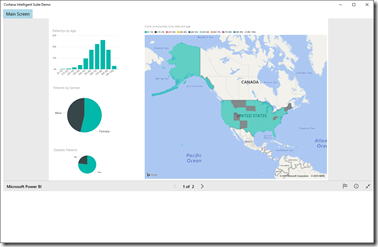
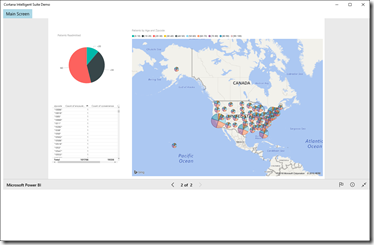
Power BI Visuals showing Patients by Age Group, etc.


