Troubleshooting Performance Issues in Windows Store Apps
In this blog post, we are going to show how to use NP .NET Profiler to troubleshoot performance issues within Windows Store Applications. You can download the tool from here.
Lets say we have a Windows Store Application that is taking time to execute on a button click event and we like to know what functions are getting invoked when that button is clicked and how long each of these functions are taking to execute.
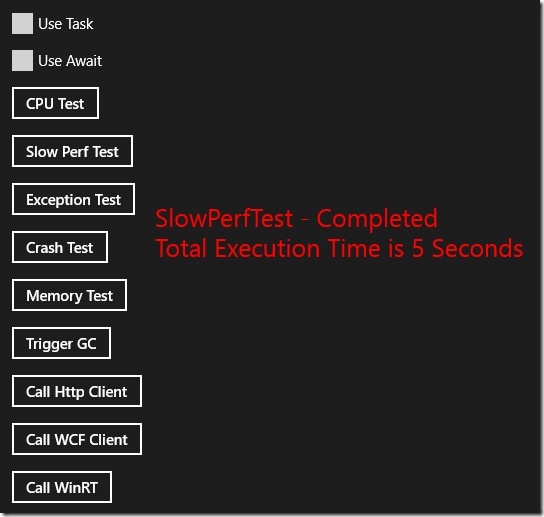
Here is my test Windows Store App, slow perf test button took 5 seconds to execute.
To determine what functions are getting invoked when that button is clicked and how long each of these functions are taking to execute, we can profiler the app using NP .NET Profiler.
Steps to capture profiler traces
Download NP .NET Profiler tool from here
Extract the NPStoreApp.zip file to c:\temp\np folder
Double click on the NPStoreApp.exe
Select the Windows Store Application from the listbox
Set the “Profiler Type” to “Performance Profiler”
Set the “Filter Type” to “Namespace Based Filter”
Set the “Filter Settings” to “Ignore System and Microsoft Namespaces”
Now, click on the “Start Profiling” button
- This will launch the application and the profiler will be monitoring the app
- The profiler log files are saved to the temp directory
- Click on the “Open Output Folder” to view the log files
Reproduce the slow performance issue (here in the test app, click on the slow perf test button)
Close the Windows Store App
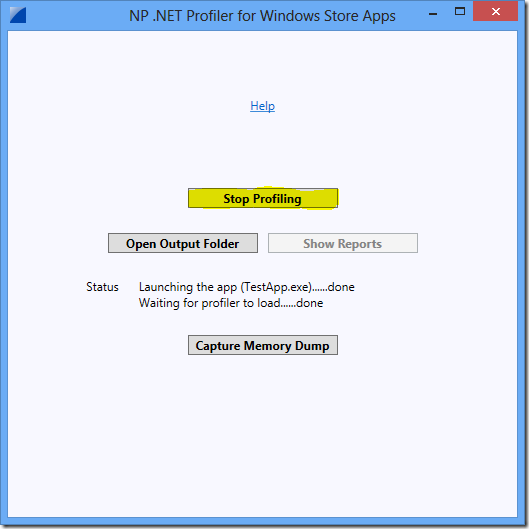
In the NPStoreApp.exe, click on the “Stop Profiling” button
Steps to review profiler traces
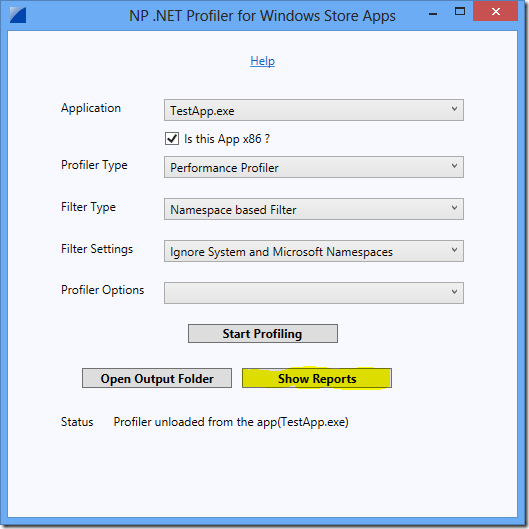
Click on the “Show Reports” button as shown below
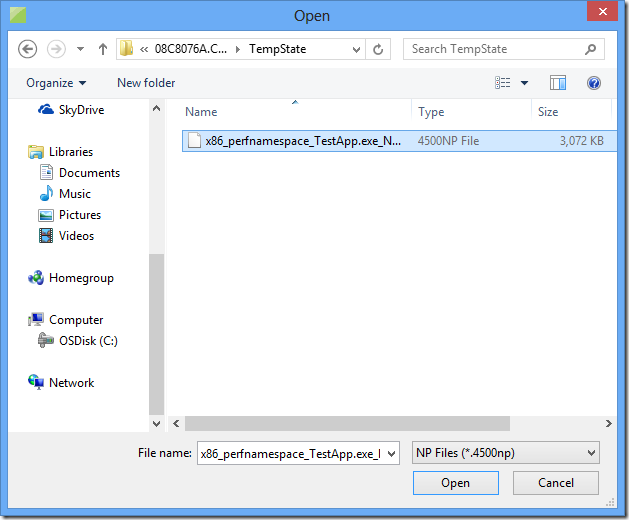
This will launch NP.exe and prompts you to select the profiler log file. Select the *.4500np file as shown below
Click the image for a larger view
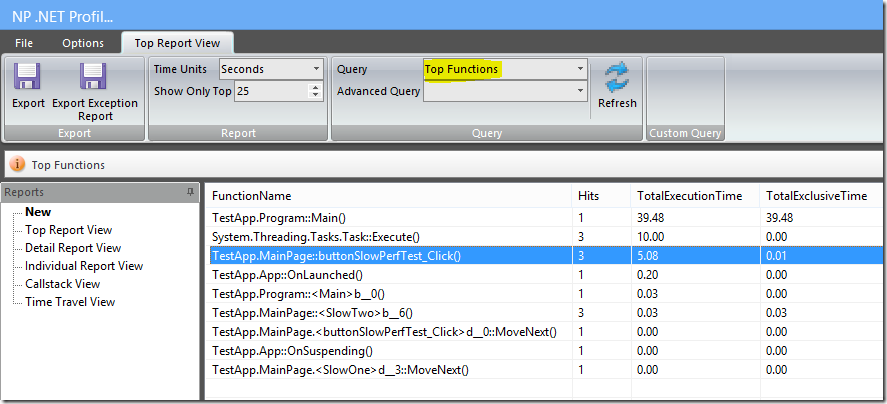
NP.exe by default shows the Top Functions report as shown. In this report we see buttonSlowPerfTest_Click() was called 3 times and the sum of execution time for all these three instances is about 5.08 seconds.
Click the image for a larger view
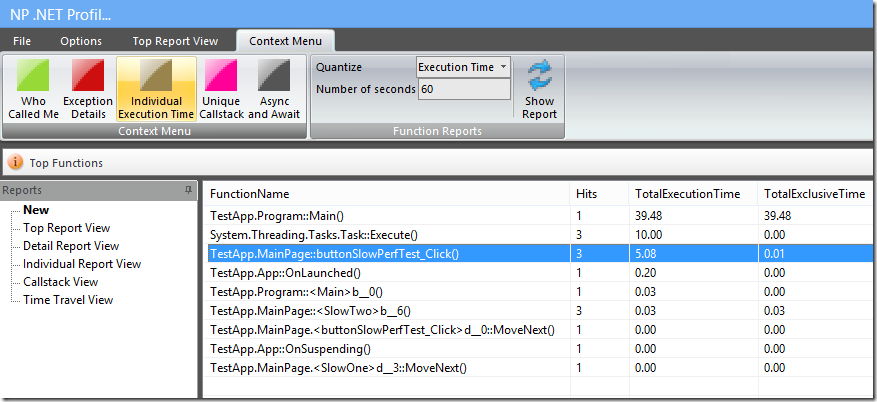
Now lets look at the individual execution time for these three instances of button click. Just select the function and click on “Individual Execution Time” as shown below
Click the image for a larger view
Here are the list of individual execution time, only one instance of button click took more than 5 seconds to execute. Other two instances of button click took less than a millisecond to execute
Click the image for a larger view
Now lets see why this one instance took 5 seconds to execute. Just select that instance and click on “Show Callstack” as shown
Click the image for a larger view
Here is the callstack of this one instance of button click that took more than 5 seconds to execute. Button click is calling few subfunctions and the last subfunction is waiting for an event for 5 seconds.
Click the image for a larger view
Comments
Anonymous
November 29, 2012
Awesome tool. Thanks for the elaborate post on what to look for in the report.Anonymous
November 29, 2012
Thank you, Please feel free to ping us if you have any issues with the tool.
