Troubleshooting Memory Leaks in Windows Store Apps
There are many options to troubleshoot memory leak issues in .NET applications. Most common approach is capturing a memory dump just before terminating the process and looking at the object count and gcroots. Most of the time this approach works, but in few cases where the application has too many short lived and too many long lived objects, it is hard to determine which objects are leaking and which objects are cached.
Another common approach is capturing multiple snapshots at the same location of the application after executing the application functionality that causes memory leaks. Comparing these snapshots, we can easy tell which object count is increasing and we can do gcroots on only those objects.
In this blog post, I would like to show how NP .NET Profiler can collect multiple snapshots and generate different reports to determine which object count is increasing.
Steps to capture profiler traces
Download NP .NET Profiler tool from here
Extract the NPStoreApp.zip file to c:\temp\np folder
Double click on the NPStoreApp.exe
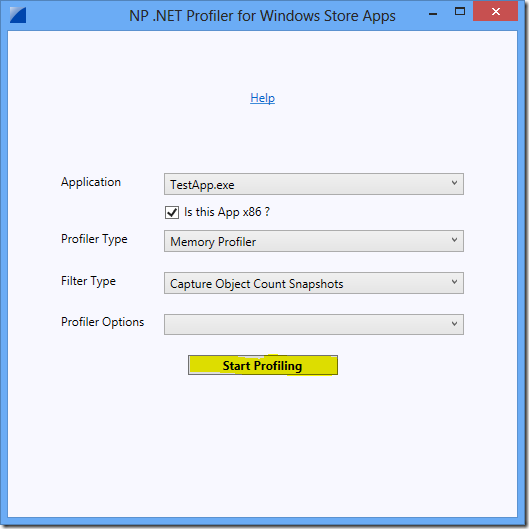
Select the Windows Store Application from the listbox
Set the “Profiler Type” to “Memory Profiler”
Set the “Filter Type” to “Capture Object Count Snapshots”
Now, click on the “Start Profiling” button
- This will launch the application and the profiler will be monitoring the app for object allocations
- The profiler log files are saved to the temp directory
- Click on the “Open Output Folder” to view the log files
Reproduce the memory leak issue (here in the test app, click on the memory test button)
After the first iteration, capture a snapshot by clicking on the “Capture Memory Snapshot” as shown below
The snapshot count increases as shown below
Repeat the same steps to reproduce the leak few more times and click on the “Capture Memory Snapshot” button after each iterations
Now click on the “Capture Memory Dump” to collect a full memory dump of the process
Now click on the “Stop Profiling” button
Close the application
Click on the “Show Reports”, this will launch NP.EXE and generates different reports
The default report is “Compare object count with snapshot # 1“, here is the report. From this report it is clear that System.Exception objects are getting created in each iteration and are not getting released
Click the image for a larger view
Comments
- Anonymous
November 22, 2013
The comment has been removed


