How we checked and fixed the 503 error and Performance issue in our Azure Function
How we checked and fixed the 503 error and Performance issue in our Azure Function
Since we released our Azure Function that allows you to use LaunchDarkly services with our VSTS Roll Up Board widget extension, we have recently evolved it further by adding an Azure Function that allows you to retrieve the flags of the user connected to Visual Studio Team Services (VSTS).
The goal of this evolution was to centralize all the business software of the features flags in Azure Function and thus leave it free of the code of the VSTS extension. This allows it to plug other extensions with the features flags in a much more simplified way thus requiring the least possible development.
Shortly after release, a user reported an issue loading the extension.
503 Error
Indeed after local tests, we reproduce the user's problem that the Azure Function "GetUserFeatureFlags" returns a 503 error and that the response detail is « The function Host is not running »
Our first step in troubleshooting is to investigate the metrics reported by Application Insights one of the elements we took care to put in place from the beginning of the developments of our Azure Function as explained in this article Azure Function integrating monitoring with Application Insights, which we explains the steps to integrate Azure Function monitoring with Application Insights
In the "failures" section [1] we do have our error that came up:
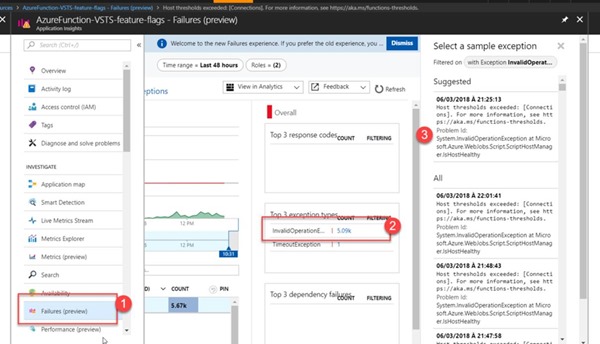
[2] Top Exception type: InvalidOperation. System.InvalidOperationException at Microsoft.Azure.WebJobs.Script.ScriptHostManager.IsHostHealthy
[3] Details of the error: Host thresholds exceeded: [Connections]. For more information, see https://aka.ms/functions-thresholds.
In summary the link provided in the error indicates is that we have reached the maximum number of connections and threads allowed for a "Consumption" type plan.
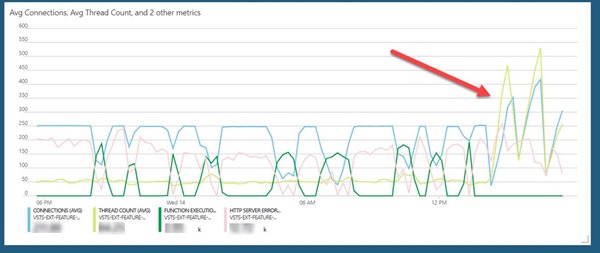
This is exactly what we see in the metrics of the Azure Function App which shows that we have reached 300 connections and 512 threads.
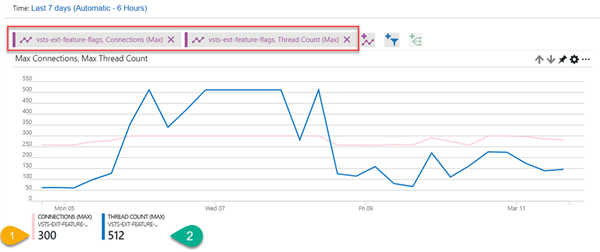
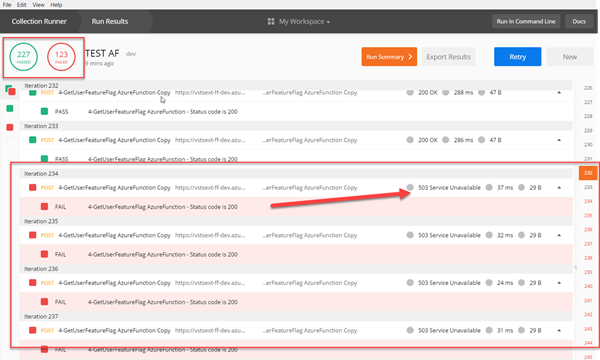
To reproduce the problem on our sandbox environment and thus determine the best resolution, we re-run our integration tests (conducted with Postman using the Runner Collection) by running the tests of the Azure Function on 350 iterations
As soon as we approach 300 connections the tests fail with the same 503 error.
For more information on our integration tests with Postman, you can read our article where we exposed how to use Postman to test our Azure Functions here.
Correcting this problem required two steps:
- The first was to immediately unblock this limit because the extension was no longer loading for all users.
- The second step was to understand the root cause of the problem why so many connection and threads were being spawned.
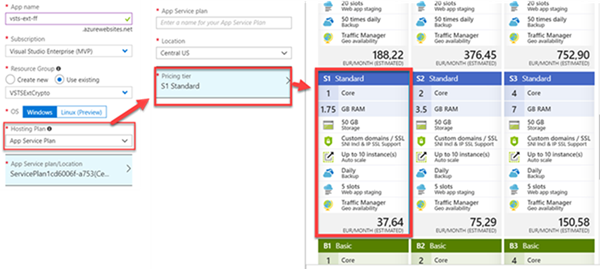
To unlock the limit quickly we upgraded the plan mode to an App Service plan mode and chose a Standard type.
What we have made dynamic in our ARM templates of our infrastructure with additional parameters (see Azure Function Provisioning and configuring our Azure Function Infrastructure) and thus modified our DevOps pipeline in VSTS to be able to change this configuration as needed according to the environments.
After the deployment of this infrastructure change, the VSTS Roll Up Board extension loads successfully again. To validate our deployment we return to Application Insights The metrics show that we have unlocked the connection and thread limit.
Performance issue
Now that the connection problem is resolved, we had to understand what was causing so many connections.
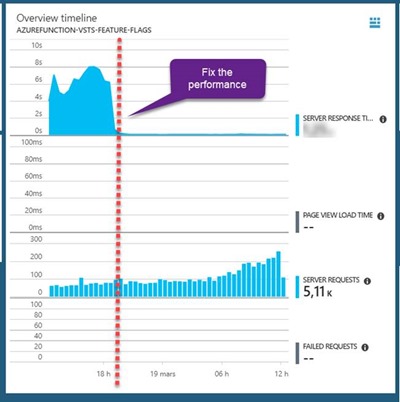
Once the limit was raised, we immediately noticed an abnormal slowness of the loading of the extension which was due to our Azure Function which responded in 10 sec approximately. (5 sec on our sandbox and 10 secs in production)
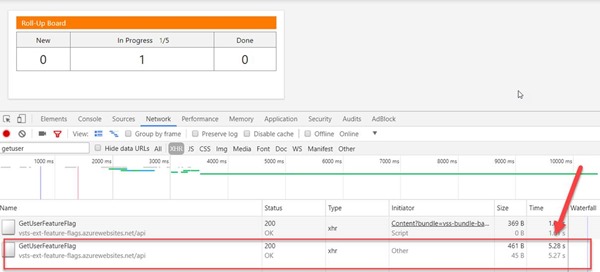
This is extremely slow for the minimal processing this Azure Function does.
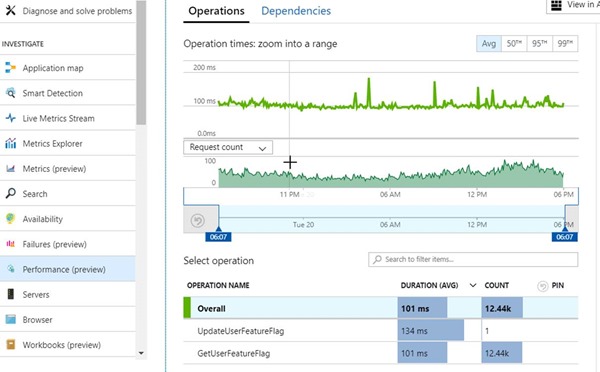
The metrics reported in Application Insights reflected this performance problem very clearly.
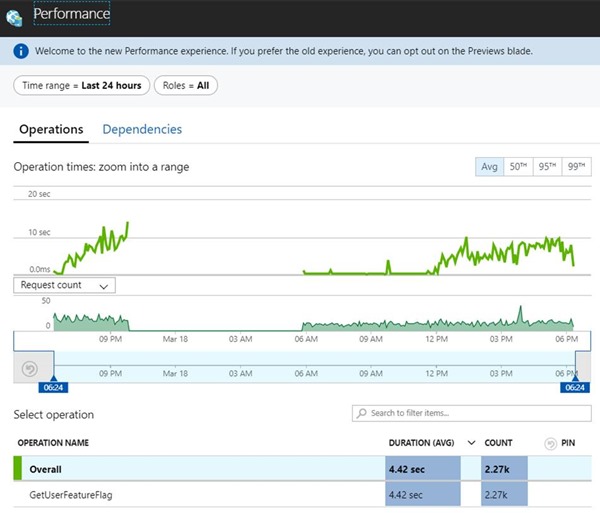
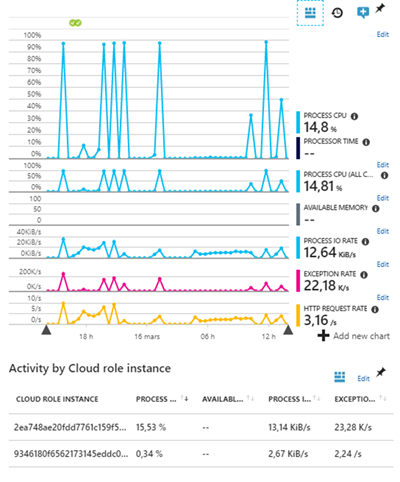
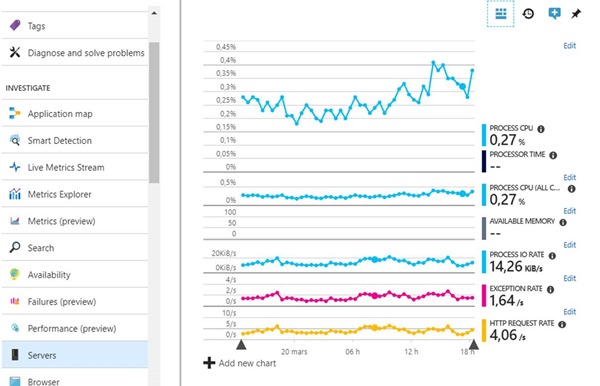
But also revealed a CPU process problem that was very high
After reviewing the source code of our Azure Function, we optimized the use of LaunchDarkly SDK through static initialisation of the LDClient instance , following in particular the recommendations of the Azure document on .Net SDK (https://docs.launchdarkly.com/docs/dotnet-sdk-reference).
Sample of the code the fix
After the code optimisation
A few days later we deployed a patch to our Azure Function and VSTS Roll Up Board extension.
The source code is available here:
- Azure Function VSTS feature flags: https://github.com/ALM-Rangers/azurefunction-vsts-feature-flags
- Roll Up Board Widget: https://github.com/ALM-Rangers/Roll-Up-Board-Widget-Extension
This created an improvement on:
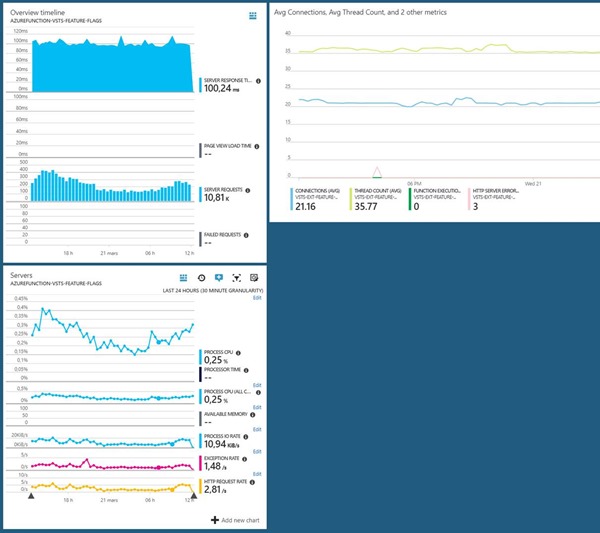
And all of this has had a very strong impact on the number of connections which today does not exceed 40.
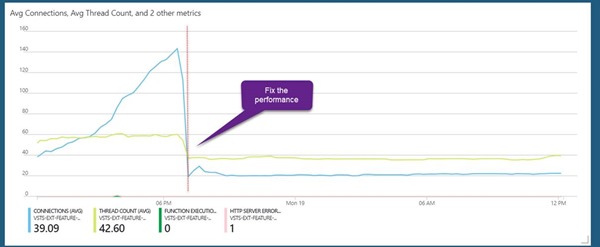
3 days later...
Since this update, we have "kept an eye" on the metrics provided by Azure and Application Insights to make sure we have made the right correction so that we can be quickly responsive in case of any issues . And 3 days later, at the time of writing this article, here is a Dashboard of the metrics Performance, CPU and number of connections.
Summary
Mission accomplished... We have fixed a connection and performance problem on our Azure Function. But this would not have been possible without setting up monitoring from the beginning of the implementation of our Azure Function, a concrete scenario which confirms the importance of monitoring in the DevOps process.
THANKS REVIEWERS – Lia Keston, Geoff Gray
Comments
- Anonymous
April 04, 2018
Did you consider going back to the consumption plan?

