POP QUIZ: What to do next? – part 1
So here is the situation. I will lead you down the debugging path and get us to a certain place and then ask you guys to solve the rest of the problem. As before, leave your suggestions as comments. I will wait until noon tomorrow to post any of the comments and the answer.
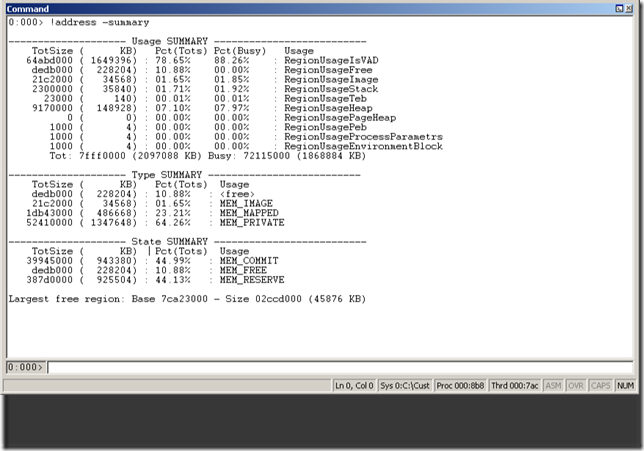
So the situation is something we have talked about a lot already, running out of memory. We capture a dump and start looking to see what the problem is. As we did in High Memory continued – Datatables, we first check !address -summary and we see:
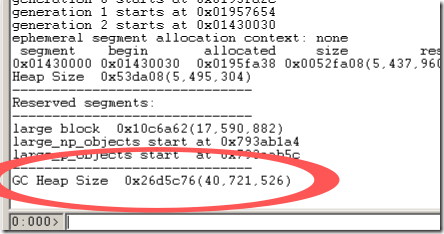
So we are running out of memory as our largest contiguous free block is only 45876 KB. If we have to try to grow another managed heap segment, we don’t have enough space and so we will get an System.OutOfMemoryException. So from this, it looks like most of the memory is in the RegionUsageIsVAD section, or virtual memory. So we look at the managed heap, running !eeheap -gc and we see:
So what should we look at next? What are the possible causes of our allocated memory?
I'll update this posting with more commands when people suggest them so we can continue looking for what the problem is and how to fix it. I'll post tomorrow the full findings and how to fix it.
UPDATE
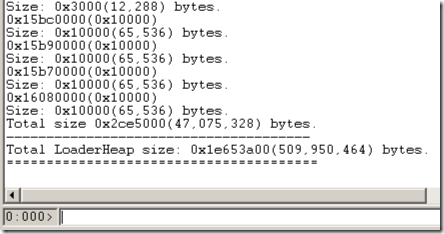
So I got a comment asking about the loader heap and saying it could be too many reflection emited assemblies. Here is the output of looking at the loader heap. I just put in the end as the individual entries don't matter as much as the end result. So now what?
I'll give another day for people to try to say what we should do now. Does this give us somewhere to go? Or do we need to go in another direction?
Comments
Anonymous
March 26, 2008
Interesting problem. I will try to solve the puzzle. Josh Coswell http://riverasp.netAnonymous
March 26, 2008
May be too many reflection emited assemblies or assemblies created by improper usage of XmlSerializer. We should look at the loader heap.Anonymous
April 01, 2008
I would summarize the objects on the heap using !dumpheap -stat to get an idea of what, the number, and size of the objects on the heap.Anonymous
April 02, 2008
Since the !eeheap -gc shows objects are worth 40 MB, I would find out !dumpdomain -stat and then look out !dda. I would also check if the assemblies are in debug mode (!finddebugtrue)


