Finding the threshold for SharePoint 2013 crawler “Transaction Waiting”
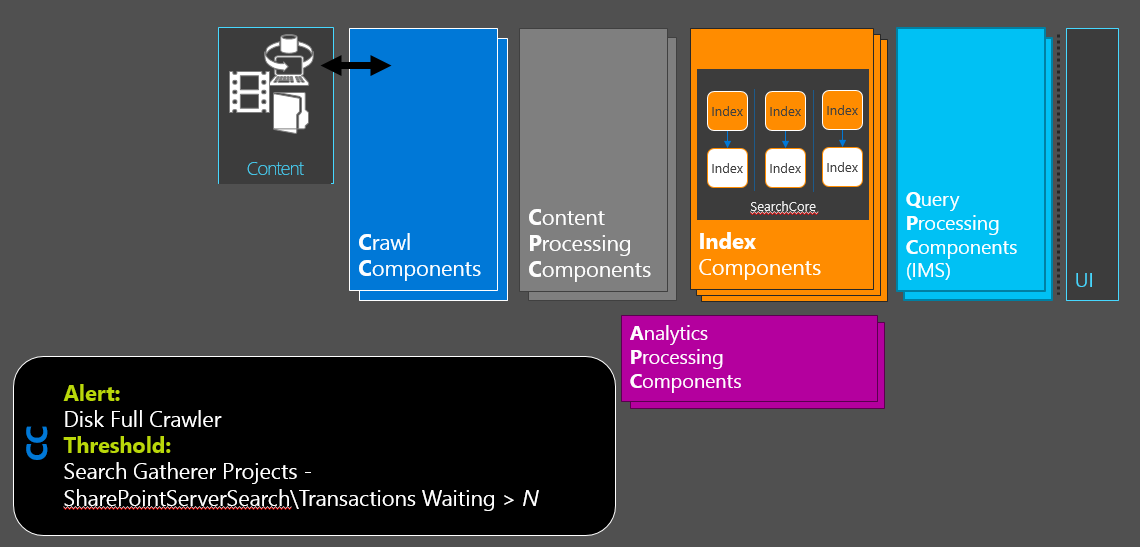
During my presentation at Ignite 2015 I described monitoring for the SharePoint Crawler data point “Transaction Waiting”, also known as from the crawler health report “Crawler Load”.
This blog is about how to find the threshold number “N” from a baseline in your environment.
From MS Ignite 2015:
First we have to explain what that value is and why it matters. The value is a very important feeding data point when troubleshooting or during content feeding tuning. The data point is shown in graph form in Crawl Load report under the Crawl Health reports off of the SSA.
What you need to know is that having a steady or plateaued high number here can be “normal”, again it’s about finding a baseline. This is not a latency report but a count of items.
Take for example the report below where we see 4 large plateaus all just under 100K items over a 19 hour time frame during full crawls of an environment.
Yes, this is completely normal for this environment. Here we can find a solid threshold of just under 100K (as shown by the red line) for 4 hours at a time and which you can then set your threshold around that to find any anomalies.
Using this great car on a bridge analogy from my colleague Brian Pendergrass we see that it is common for this to be “backed up” during a full crawl or “rush hour”, think more in terms of how many cars are there on the bridge not how long have they been there, the cars could all be moving at 100MPH and that is ok.
Now if your numbers are not normal and continuing to climb or plateau for long periods of time then you want to look at the “Crawler Latency” report next to see why and what it is the crawler waiting on.
For some more troubleshooting and tuning on feeding and crawling please check out Peter Dempsey’s great 3 piece blog on the subject.


