Visual Studio Race Detection for C++ AMP
Hi, my name is Cagri Aslan and I am a developer in the Visual Studio debugger team working closely with the C++ AMP team. In this post, I’m going to talk about the race detection capability we’ve added to Visual Studio for C++ AMP code.
With this feature, when you run your C++ AMP code against REF with the GPU debugger attached, you can catch common memory access hazards. These memory access hazards typically occur where multiple threads access the same memory location concurrently without the correct use of thread synchronization mechanisms, such as barriers and fences.
Enabling race detection
Many of you are probably familiar with the ‘Exceptions’ dialog under the Debug menu. In Visual Studio 2012 you’ll find a new node/option: ‘GPU Memory Access Exceptions’. Under that node you can see all the available runtime GPU memory access checks and you can individually turn them on or off. – see the following screenshot:
Below is a short description of each one
1. Detect uninitialized data
This option catches any uninitialized memory reads.
2. Detect read after write hazards
This option checks for read-after-write (RAW) data hazards between threads in the same tile where an instruction tries to use a result that has not yet been calculated (“read too soon”).
3. Detect write after read hazards
This option checks for write-after-read (WAR) data hazards between threads in the same tile where an instruction tries to write a destination before it has been read by another instruction (“written too soon”).
4. Detect write after write hazards
This option checks for write-after-write (WAW) data hazards between threads in the same tile where an instruction tries to write a destination before it is written by another instruction (“written out of order”).
5. Detect read after write hazards across thread groups
This is the same as the read-after-write checks but is performed specifically across thread groups (tiles)
6. Detect write after read hazards across thread groups
This is the same as the write- after-read checks but is performed across thread groups (tiles)
7. Detect write after write hazards across thread groups
This is the same as write-after-write checks but is performed across thread groups (tiles)
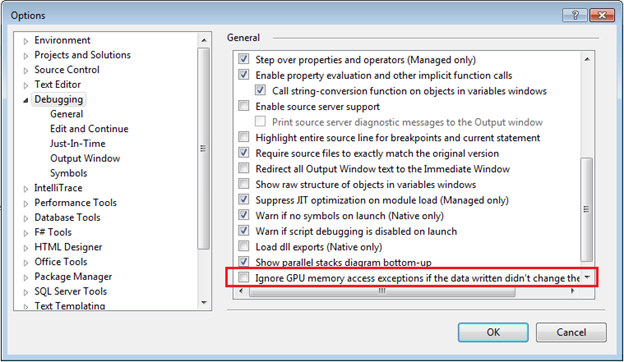
In addition to the options on the Exceptions dialog, there is also a new debug option (under Debug->Options) for race hazard detection where you can choose to automatically ignore the aforementioned race hazard warnings if a new memory write is detected but the value written didn’t change the original value. This is mainly to help eliminate warnings for benign race conditions:
Race detection in action
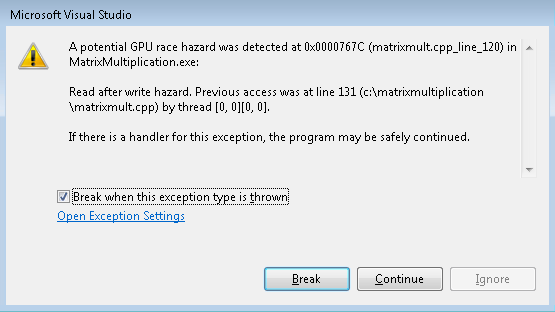
After enabling the aforementioned options, when you execute your C++ AMP code under the GPU debugger, if the code contains the hazard you will be notified. For example, take any of the tiled C++ AMP samples, comment out the line containing a barrier (e.g. //t_idx.barrier.wait();), enable all the options and run under the GPU debugger. You will see the familiar exception dialog, for example like this screenshot:
The dialog contains the warning message and two buttons, one to break into the debugger and another to continue execution.
If you Continue execution, the hazard is ignored and the application behavior will be such as if you hadn’t used the race detection capability (and that behavior may include a crash, incorrect results etc.). Unlike CPU exceptions, this warning will not be reported at the same instruction for the remainder of the GPU kernel execution. This is so that you don’t get the same error dialog for all the threads executing this instruction.
If you Break, then just like a regular breakpoint, the current statement cursor will be at the source line that triggered the warning and the Debug Location toolbar will show the id of the thread that just executed that statement.
The checkbox option is the new feature already described as part of the Exceptions dialog.
Stay tuned
I will be sharing separate blog posts with targeted code examples for:


