Breaking Down Microsoft BI
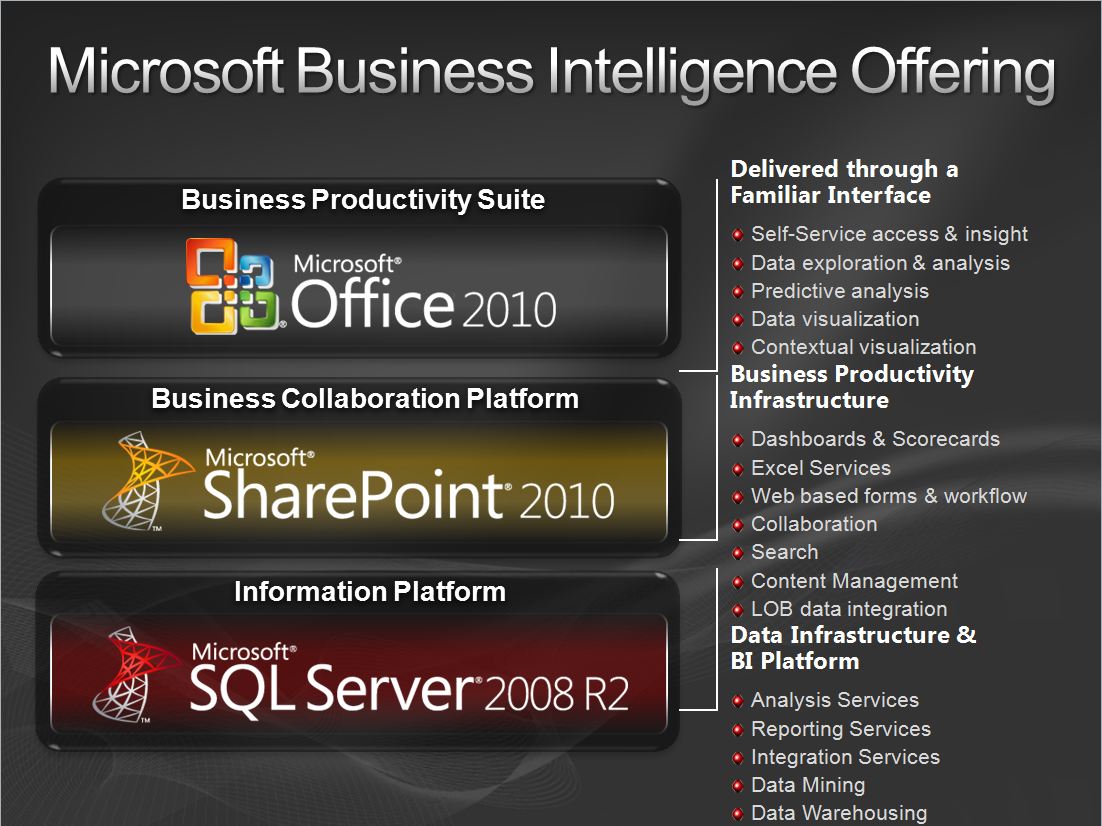
I get a lot of questions around what is Microsoft Business Intelligence and I wanted to explain the answer from several perspectives. First, Microsoft BI is not a product, it is a set of capabilities delivered through core technologies that empower all of the users across your enterprise to deliver results.
From a technology perspective it is comprised of 3 key technologies (SQL Server, SharePoint, and Office).
As part of this stack Microsoft provides a set of tools to build BI solutions for every audience in the organization.
End Users
PowerPivot: An Excel add-in enables Excel power users to easily create powerful BI solutions by streamlining the integration of data from multiple sources enabling interactive modeling and analysis of massive amount of data and by supporting the seamless sharing of data models and reports through Microsoft Office SharePoint 2010.
SQL Server 2008 R2 Report Builder: An ad-hoc reporting client that accelerates report creation, collaboration and consistency by allowing users to create and share report components that can be accessed via the shared component library and by enabling the rapid assembly of comprehensive business reports using these shared components. Report Builder 3.0 also has support for geospatial visualization including mapping, routing, and custom shapes can help your end users create customized reports that leverage existing content objects, such as queries, data regions, and charts and graphs. You can also enhance location-based data reports with Bing Maps in Report Builder 3.0.
Developers/Report Authors/Data Architects
SQL Server 2008 R2 Business Intelligence Development Studio(BIDS): SQL Server Business Intelligence Development Studio (BIDS) is the tool that provides intuitive wizards for building integration, reporting, and analytic solutions in a unified environment. BIDS supports the entire development life cycle of developing, testing, and deploying robust, highly secure, scalable solutions. In addition, developers will now enjoy updated support for RDL 2008 directly from Microsoft Visual Studio® and enhanced event and Ajax support on Report Viewer.
Dashboards and Scorecards
SharePoint Server 2010 PerformancePoint Services:A performance management service that you can use to monitor and analyze your business. By providing flexible, easy-to-use tools for building dashboards, scorecards, and key performance indicators (KPIs), PerformancePoint Services can help individuals across an organization make informed business decisions that align with company wide objectives and strategy. Dashboards, scorecards, KPIs, and reports help drive accountability. Integrated analytics help workers quickly move from monitoring information to analyzing it, and where appropriate, sharing it throughout the organization.
Presentation/Delivery
SharePoint 2010: SharePoint 2010 makes Business Intelligence (BI) available to everyone, it can help all your people-and the entire company-be more effective and efficient. It allows people to work naturally and confidently, thanks to a familiar user experience. Because SharePoint 2010 uses well-known applications and interfaces, people are comfortable from the start, and they know how to get the data they need.
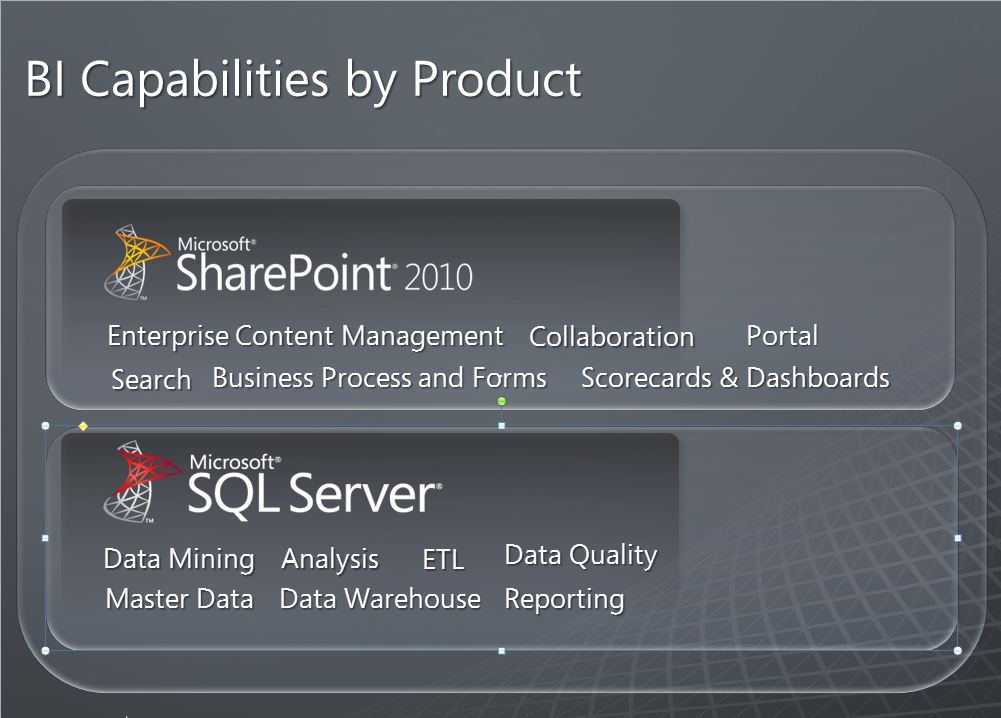
From a capabilities perspective the slide below shows where the key BI capabilities map to what products.

