Leveraging Microsoft R and in database analytics of SQL Server with R Services through Alteryx Designer
This post is authored by Bharath Sankaranarayan, Principal Program Manager at Microsoft.
Being part of the Microsoft R Product team I get to use Microsoft R regularly, but not often with a drag-and-drop editor that simplifies the effort needed to build a solution using machine learning. In this blog, I will take you through a tour of how Microsoft R Server and SQL Server 2016 with R Services work in Alteryx, something that the Microsoft R product team and Alteryx worked on. The release of Alteryx Designer 11 added capabilities of in-database analytics that was made available in SQL Server 2016. I am going to assume you have Alteryx set up. If not, you can get a trial version of the designer through Alteryx.
I wanted to try how to model training and scoring (prediction) work with Alteryx Designer without writing code, and see how in-database analytics work with SQL Server using the in-DB tools that Alteryx has built. I also wanted to do a comparison with the local Microsoft R version based on Open R. As I already had Microsoft R Server 9.0.1 installed locally, when I installed the Alteryx Predictive Analytics Tools it detected that I had Microsoft R Server and enabled the features. You can follow the instructions here for your needs.
The scenario that I had was a simple one in that I wanted to target customers who are likely to respond to a new marketing campaign as it related closely to the Marketing Campaign Optimization solution that we released. The dataset used was synthetic but nevertheless was good for this. For model training, I used the data from customers who responded to a direct mail and this was labelled data. I also had the data with past transaction data of the customer spend and frequency. Lastly, I used the demographic data that had the geography and the age band. I used these datasets to augment the training dataset. For scoring (prediction) I used the customers with spend and demographic data. As the goal was to determine the likelihood of a customer who is likely to respond, the problem fell into a classification problem.
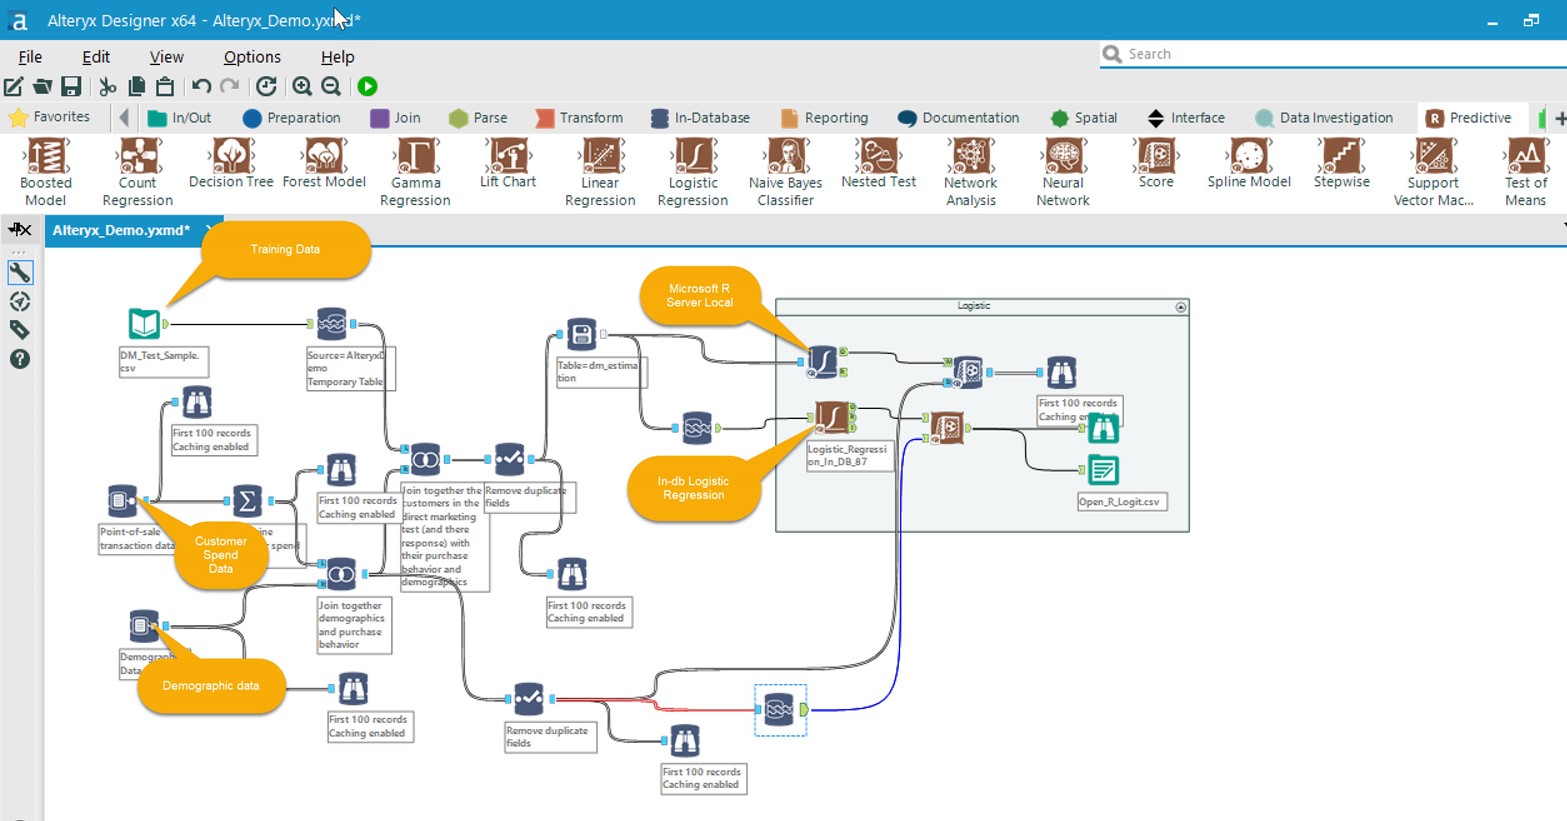
Alteryx Designer uses workflows and you can think of this as the canvas where you drop the widgets and then you connect the widgets. I hardly had to write much code! All my data was in CSV files but it was not a problem, I loaded the data over to a SQL Server database in Azure. While configuring the SQL Server 2016 VM on Azure I enabled it for R Services, an option that you can do on the Azure Portal. You also have the option of using a Data Science VM that has all the tools ready to go for you including SQL Server, which is packed with a slew of other goodies. I configured the connection to SQL Server through Alteryx and used the ODBC Native Client, but you could use SQL OLEDB or SQL Server – all of them work and this is fantastic.

Figure 1
As I was focused on leveraging in-database capabilities I pushed all the data to SQL Server. The loading of the data was a breeze using the Data Stream-in widget. I used the same widget to load the demographic and the customer spend data. I could quickly review the data via the Browse in-DB widget and filtered to browse the first 100 rows, something that you can configure. Likewise, it was easy to do filtering, joining and de-duping.
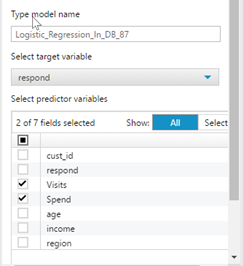
The next step was to determine the best algorithm and as this being a binary classification problem I decided to use the Logistic Regression model. As soon as I dropped the Logistic Regression widget on the canvas, the designer automatically knew I was connecting to a SQL Server data source and provided me the in-DB version of the predictive tool. All I had to do was to connect to the right nodes on the widget for modeling and then the right data for scoring. Once I did this I picked the target variable (respond) and the predictor variables (spend and visits) all using the Alteryx Designer.

Figure 2
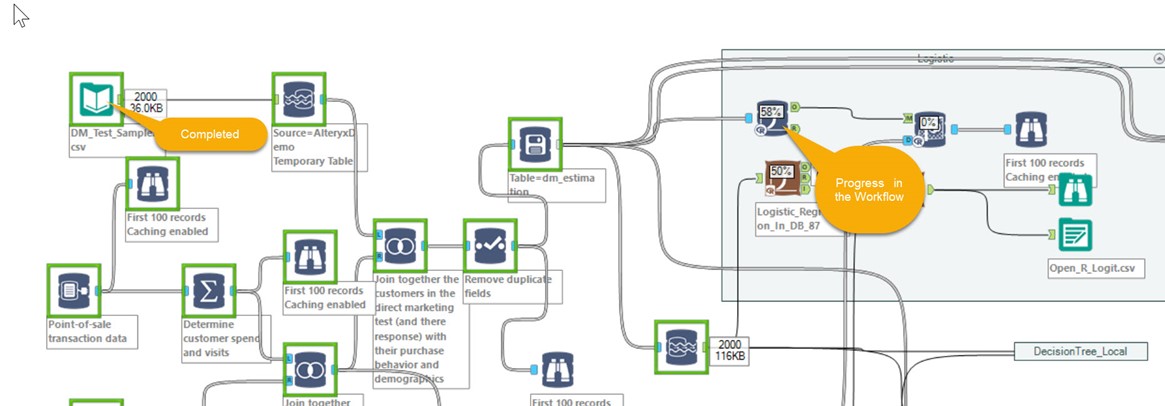
Once I verified I had the right connections and verified them after fixing the errors which were primarily due to lack of intimate knowledge, I got the workflow going. The Alteryx Designer visually shows which components are executing and provides a summary upon completion (Figure 3). Once I had the basic model working I started adding additional features such as reporting to validate my model all the way to exporting the data from the scoring over to a variety of formats including writing to the database.

Figure 3

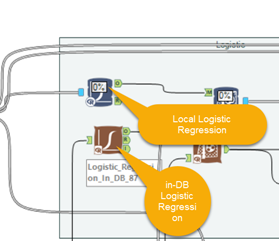
Figure 4
While I did the classic Logistic regression, I also tried a few more models like Forest and Decision Trees and it was equally easy to implement and the results were comparable. To compare how the in-DB version performed against the Logistic Regression model that is included with Microsoft R Server I included it in my canvas. Both performed nearly the same in terms of the results but the local version seemed to be a bit faster and as my data size was not very large this was the reason.

Figure 5
Having worked with R, not writing code felt a bit weird but I soon started to get comfortable using a visual editor and started to enjoy using it. I will admit that things did not work on first try akin to coding, but I did not feel that I could not complete the work. I barely knew how to use the Alteryx tool, but within a few days I was being productive. I have only scratched the surface, yet Alteryx designer together with Microsoft R Server combined with in-database analytics with R Services is packed with features that will meet your entire enterprise needs!
Bharath
Comments
- Anonymous
April 27, 2017
Very, very cool! Almost Azure ML, but on-prem! I really need to have a look at it! - Anonymous
April 28, 2017
I am using Alteryx for almost 2 years now and have never tried this.. it seems that that will be a great feature... Thanks for sharing it...- Anonymous
April 28, 2017
Thanks Deepak. I am glad this helped discover some additional ways to use Alteryx.
- Anonymous
- Anonymous
May 02, 2017
Hi, Can you publish your Alteryx file? Lars- Anonymous
May 04, 2017
Hi Lars, this is a bit complex as there are a bunch of files, the input data which are CSV's and then the workflow which has connection strings to my database. You cannot run it as it but will have to modify this. I will try to push this to GitHub.
- Anonymous
- Anonymous
June 01, 2017
The comment has been removed