Windows Enterprise Client Boot and Logon Optimization – Part 16, Wait Analysis
This post continues the series that started here.
From Part 6 to Part 15 of this post series, I’ve discussed activities that take place across, and during boot phases. I’ve shown you how to measure the phases, examine activities, consider the impact of CPU/Disk utilization and to deduce next steps in your troubleshooting.
There are occasions however, when your trace doesn’t display any activity – there’s just a long wait. This will be the topic of today’s post … Wait Analysis.
Before we get to the details, I want to stress that these sorts of issues may require you to log a support case with Microsoft. The cause for a wait is not always obvious without access to Windows source code.
In this post, I’ll illustrate the Wait Analysis process and show you when you should be able to deduce the root cause yourself (without source access).
The Nature of Waits
In order to keep this post on track, I’m going to provide an over-simplified explanation of what you’ll be looking at.
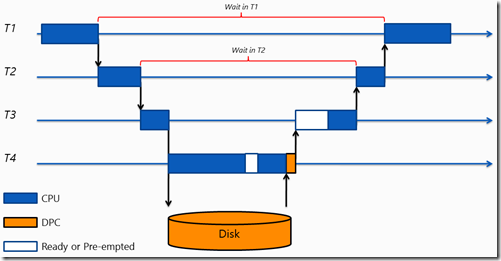
As threads execute on the CPU, they may ask another thread in another process to do work on their behalf. When this occurs, the original thread is paused – a context switch occurs. The new thread may in turn, wait on yet another thread. Viewed simply, this might look something like –
Here, thread T1 waits on thread T2 which waits on thread T3 etc.
In performing Wait Analysis, your goal is to work your way through the wait chain to see why there was a delay. Using the example above, you’d start with thread T1, discover that it waited on T2 and continue the investigation until you uncovered the I/O operation.
Preparing for Wait Analysis
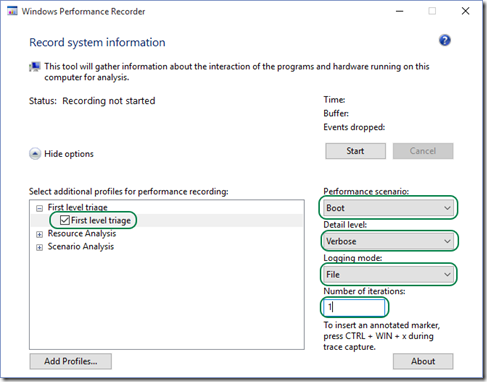
If you’ve been following my workflow so far, you’ll know that in Part 6 of this series, I suggested you capture an analysis trace using specific options in Windows Performance Recorder (WPRUI) . These same options are applicable for Wait Analysis –
You’ll also want to configure and load symbols as I discussed in Part 9.
Chasing Waits – Simple Example
The first thing you need to do after opening your analysis trace in Windows Performance Analyzer (WPA) and loading symbols, is to establish some context. You’d do this by looking for a long boot phase and zooming to it (or an activity within the phase that is delayed).
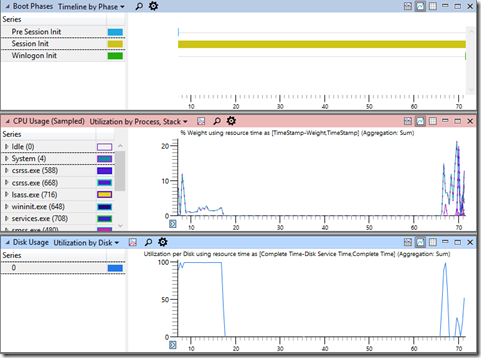
For example, consider the following trace with a long Session Initialization phase –
This is particularly strange. The Session Initialization phase goes on for around 70 seconds. During almost all of that time, the CPU and Disk Utilization is zero.
With the view zoomed to this phase, I’ll examine the Generic Events table with columns ordered as follows –
My objective is to look for large gaps in the Time column and to attribute them to a Process and ThreadID. By doing so, I have a starting point for Wait Analysis. The trick is to expand the correct provider in the Provider Name column.
The three boot phases where Wait Analysis becomes important are Kernel Initialization, Session Initialization and Winlogon. The relevant provider for each is –
Kernel Initialization Microsoft-Windows-Kernel-PnP Session Initialization Microsoft-Windows-Kernel-PnP Winlogon Microsoft-Windows-Winlogon
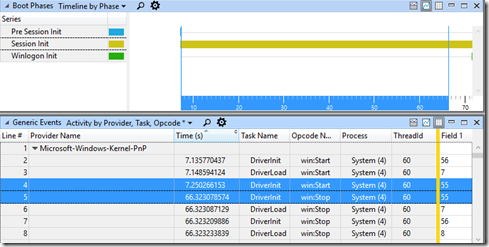
Returning to our example, I’ve already selected and zoomed to the Session Initialization phase and now I’ll expand the Microsoft-Windows-Kernel-PnP provider in the Generic Events table –
Straight away, I can see that System (4), ThreadID 60 does nothing for almost 60 seconds. This is my starting point.
Earlier (Part 9), I discussed using the CPU Usage (Sampled) graph for high CPU Utilization issues because events collected in this graph record the CPU state every 10ms. Over time, the average of those samples provides insight into CPU heavy processes.
In contrast, the CPU Usage (Precise) graph records the CPU state every time there’s a context switch (when one thread is parked to allow another thread to run). It is ideal for chasing waits.
I open the CPU Usage (Precise) table and order columns as follows –
I now expand the process of interest and look for the thread identified in the Generic Events table –
The resulting view shows me the total number of times this thread waited (during the period of time to which our graphs are zoomed), the total amount of time this thread spent waiting and the longest single wait.
My next step is to sort using the Waits (sum) column, expand the New Thread Stack column and to examine the functions being called. I look for clues that might explain the delay. As I continue to expand the call stack, I see the total number of waits is decreasing, the total time spent waiting is decreasing but my maximum total wait is staying the same. I’m getting closer to the long delay –
Keep going and eventually I see –
<PDB not found> indicates that there was no symbol file for this module. Either the symbol does not exist on the Microsoft symbol server or these binaries are third party components. A web search reveals they are third party components.
This particular example comes from a Windows 7 system dating back to 2011. When this issue was discovered, the third-party components were removed and confirmed to be the root cause. Working with the vendor, the customer was able to resolve the issue with an update to the product.
Analysis in this case was not particularly challenging. I was able to identify the delayed process/thread and the root cause presented itself quickly.
Conclusion
I’ve introduced Wait Analysis and covered a simple example. Up to this point, you haven’t seen how to follow a wait from one thread to the next. Doing so will be the subject of my next post.
Next Up
Wait Analysis – More Challenging Example
Comments
- Anonymous
August 03, 2015
Might be almost extremely difficult to see well-informed visitors on this article, nevertheless you seem like you fully grasp whatever you’re covering! Excellent
http://staygreenacademy.com/ - Anonymous
August 05, 2015
The comment has been removed


