Windows Enterprise Client Boot and Logon Optimization – Part 13, Boot Phase – Winlogon
This post continues the series that started here.
Today I’ll be discussing the Winlogon phase. A lot of activity takes place during Winlogon and it’s common to see delays here. Additionally, the interplay between activities provides an opportunity for complication so I’ll be highlighting important considerations for analysis.
Some of the activities that occur during the Winlogon phase have a dependency on supporting network and server infrastructure. I’ll write a post regarding the influence of your infrastructure at a later time.
Boot Phase Winlogon – Phase Activity
- Service Control Manager launches services
- Machine Group Policy is applied and start-up scripts are executed
- Logon Screen is displayed and a user logs in
- User Group Policy is applied and logon scripts are executed
- User profile loads and network drives are mapped
- Explorer is started
Boot Phase Winlogon – Measurement
As with the previous two phases, a summary XML file generated from a boot trace using xperf.exe displays the phase duration as WinlogonInit –
Alternatively, the Regions of Interest graph (discussed in Post 11) shows this phase duration as Boot-Winlogon-Phase:
Boot Phase Winlogon – Potential Issues
As you might imagine, there’s a reasonable degree of complexity here.
Let’s begin with Services –
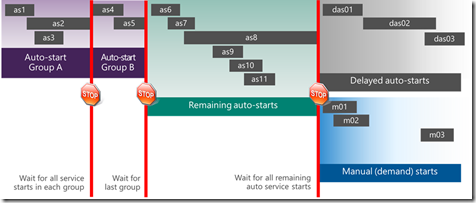
- Disk contention may impact service start times
- All services configured for auto-start are started as soon as possible
- Grouped auto-start services block the next group until they all start
- Ungrouped auto-start services wait for auto-start groups
- Demand-start and delayed-auto-start services wait on auto-start services
You can envision service start as follows (again, thank you Matthew Reynolds for this conceptualization) –
In addition, consider –
- The Network List Service is demand-start
- If Group Policy processing is synchronous, it will wait for the Network List Service
- i.e. it waits for all auto-start services
Moving on to Group Policy –
- Synchronous processing waits for the network which waits for auto-start services
- Triggers for synchronous processing
- Always wait for the network at computer startup and logon policy setting
- Folder Redirection
- Roaming User Profiles
- Software Installation (via policy)
- Home Drives
Consider also that –
- Excessive numbers of GPOs increases processing time
- Fewer GPOs each with more settings are generally processed more quickly than more GPOs with fewer settings
- Start-up and logon scripts add time
- Especially true when processed synchronously
- PowerShell scripts trigger loading of .Net libraries before they can process
- WMI and Security filtering impacts processing time
- WMI is often very expensive
And lastly, User Profiles –
- Local user profiles are generally fast to load
- Large roaming user profiles may introduce delays
- Heavy dependency on network and server infrastructure
Boot Phase Winlogon – Remediation
After examining CPU and Disk utilization, the first avenue of investigation is to expand Boot-Winlogon-Phase: in the Regions of Interest graph. By doing so, we see a breakdown of activities with the Winlogon phase –
The example above provides some insight that the User Profile has loaded quickly but Group Policy is a contributing factor, both during machine policy processing as well as user policy processing. With this information, I’ll want to check whether policy processing is in synchronous mode.
To do this, I’ll select and zoom to Boot-Winlogon-Phase: , open the Generic Events table, order columns as follows and then expand the Microsoft-Windows-GroupPolicy provider –
Now that I know synchronous processing of Group Policy is taking place, I will also examine the Services graph and table. Once again, column ordering is important –
Now I’ve identified a slow starting service, I would investigate whether it may be moved to delayed-auto-start and seek an update from the vendor.
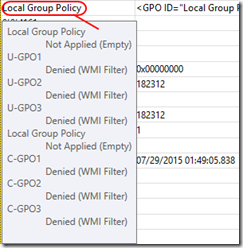
If I move back to the Generic Events table (using exactly the same layout as above), scrolling further down reveals two rows. The first row represents the Group Policy Objects that have applied while the second row represents the Group Policy Objects that have been filtered. These rows are a little hard to find but Field 1 contains useful information that shows up in a tool tip when you mouse over it.
Applied GPOs (machine) –
Filtered GPOs (machine) –
I see that C-GPO1 and C-GPO3 are not applied due to a WMI filter. WMI filtering may be a very expensive operation so my next avenue of investigation would be to examine those filters and attempt to exclude those Group Policy objects using another method.
Similarly, when I scroll down further still, the Generic Events table shows applied and filtered Group Policy Objects for the user –
Applied GPOs (user) –
Filtered GPOs (user) –
Here, no Group Policy Objects are applied to the user and several are filtered using WMI. In addition, I can see that some of them were also applicable to the computer which may be an indication that Group Policy loopback mode is in use. These are facts I can use to look for Group Policy optimizations.
Lastly, after zooming to Boot-Winlogon-Phase: , I can use the Process Lifetimes graph and table to identify processes that may have been launched by start-up or logon scripts –
Transient processes whose life ends within GPClient phases (computer or user) may provide clues regarding script execution delaying the user experience. Consider script optimization or moving script functionality to Group Policy Preferences (where possible).
Conclusion
Winlogon is a complex phase with a lot going on. Windows Performance Analyzer (WPA) provides useful insight into the phase activities and makes it easier to isolate problems. As you’ll find, it takes some time and experience to become familiar with the workflow I’ve described but with practice, analysis with these tools is powerful and specific.
Next Up
Boot Phase – Explorer Initialization
Comments
- Anonymous
August 05, 2015
The comment has been removed - Anonymous
August 11, 2015
This post concludes the series that started here . Over the past few weeks I’ve presented a “lite” version - Anonymous
September 22, 2015
Hi Mark,
Great artilce. When I load the Regions of Interest definition, I can't see the Boot-WinLogon-Phase. I can only see up to the Boot-SessionInit-Phase. I can see the Winlogon phase in the standard "Boot Phases" graph in the analysis window. Have I missed capturing something? Do you know why the regions of interset doesn't populate with the Winlogon info?
Regards,
Adam - Anonymous
September 22, 2015
Hi Adam
If you look at the XML file that defines the regions of interest, you'll see that it looks for specific events that mark the beginning and end of phases. I'd guess that the events required to identify the beginning and end of the Winlogon phase are missing in your case. Did you get any messages when you opened the trace that might indicate lost events or buffers?
As you've noted, the Boot Phases graph and the Winlogon graph give you another way of examining the boot phase duration and the Winlogon phase activity - and in fact these were the original tools for analysis before WPA included Regions of Interest. You should be able to begin your analysis in the same way using these other views.
HTH
Mark


