GPU Usage for DirectX in Visual Studio
In both Visual Studio 2013 Update 4 and in the new Visual Studio 2015 Preview releases there is a new GPU usage tool for helping to diagnose issues with DirectX performance. On the VC blog our team’s program manager already provided a really solid quick look at this new feature. That article is best introduction to this tool, but as one of the primary developers for this tool I also like to put some more detailed information about how this tool works and some scenarios in which it can be used on my own blog.
Launching
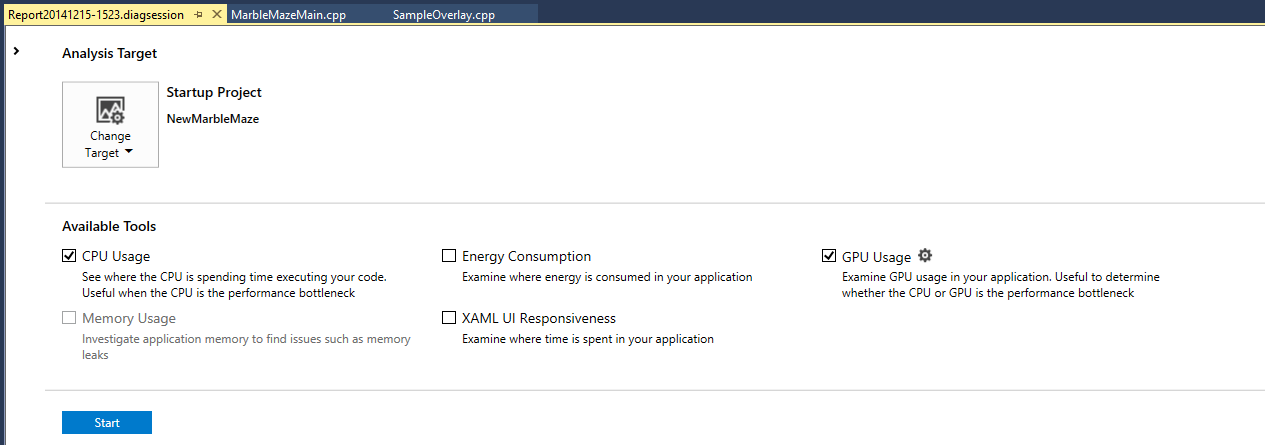
When the GPU usage tool is started up the initial launching is handled by the Visual Studio Diagnostics Hub framework. This allows us to share launching behavior with other Visual Studio tools like the CPU usage or Memory usage tools. In addition, many of these tools can be combined into one single performance run, so you can do a single run to collect data for both GPU usage and CPU usage of your application. This hub can be opened with the Alt-F2 key combination or via Analyze->Start Diagnostics Tools Without Debugging option.
The diagnostic hub supports a number of diagnostic tools and allows for a variety of different project types to be targeted. Each tool can control what projects it is viable for, and will only allow for it to be enabled for those projects. The GPU usage tool is actually language agnostic in function. DirectX information is captured only at the GPU level and could be triggered by any type of project at the top level. For example, while DirectX is a C++ thing it could also be accessed through a C# project via SharpDX or a Python project via DirectPython11. As such, GPU usage is available to any basic project type targeting Windows Store or Windows Desktop. As there do not currently exist any phones that support both DirectX and the advanced driver data that we need for the GPU usage the feature is disabled for phone targeting projects.
In addition to Visual Studio projects you can also collect GPU usage data on any loose .exe applications that you have sitting around. Just open the executable as a solution in Visual Studio and then start up a diagnostics session and you can target it with GPU usage. This way if you are using some type of engine or alternative development environment you can still collect data on it as long as you end up with an executable.
Next to the GPU usage checkbox you’ll also have a small options page that you can bring up. The only option currently in here is the option to either start collection up right as you launch the application or to start up collection manually at a later point. The issue here is that when collecting data you’ll be logging events for everything that’s happening on your GPU as well as a fair amount of CPU data, which adds up relatively quickly. In our testing we can easily handle minutes of collection on AAA games so there is some leeway here. But it’s not something that you can just leave on and running all the time. So if you have isolated your performance issue to just a specific part of your game or app, it’s best to set GPU usage to start manually, navigate close to where you want to collect performance data, and then start collection then. Smaller file size also helps with keeping analysis time faster when collection finishes up.
Collection
Like most of the diagnostic hub tools GPU usage collects and then analyses Windows ETW events to provide its data. Collecting the correct set of events can actually be a bit of an arcane process when trying to manually collect ETW data, so it’s nice that VS handles all of the collection and deployment steps here for you. If you are using a VS project that is deploying to a remote machine then the hub will automatically collect on that remote machine and then bring that file back to the visual studio box for analysis.
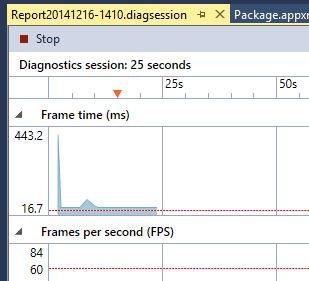
When collection start up you’ll see a screen like the following running in VS.
At this point all of the ETW events that are getting collected are getting placed into a .diagsession file for storage. We don’t do any analysis at this point, as that is too expensive and long of a process so it would interfere with both the collection of the events and with the performance of the running application. However we do look at a small set of ETW events as they pass through into the log to show the information in the charts that VS displays while collecting. The top two charts that we show look at Present commands from the targeted application and check the time between them to tell both FPS and FrameTime values for this application. On the charts we’ve added a combo box to select a guideline targeting either 60fps or 30fps to help tell when your application performance is not up to snuff. If you selected to start full profiling manually you will still see these charts while running, but underneath the covers the events will not be saved into the logs aside from the events needed to generate these charts. We did this so users would still have the charts available to help figure out when to turn on full profiling during their repros. For manual starts, when you click the link to start full profiling we’ll place a small mark into the timeline at the top of the charts, this gives you the indication of where in the log you started collecting full data at. Later on during analysis you can use this mark to know after what point you can start selecting chunks of data for deeper analysis.
Collection can be terminated via either the stop button above the charts or via the stop link on the page.
Analysis
When collection is stopped a few things will happen to get this log opened up in Visual Studio for analysis. First off you’ll have a stage where the diagnostics hub brings the log back to the Visual Studio machine (if you were collecting remotely), and where the file is prepped for analysis. Of note here, while this stage should usually be relatively quick, it can be much longer if you are in a remote collection scenario and have collected a large file, or if you are running multiple diagnostic tools at the same time. When running multiple tools at the same time the ETW log files are merged before analysis, and this can be a bit of a time hog.
After that first analysis stage finishes you’ll then see a set of progress bars that look like this. If you selected multiple diagnostic tools you’ll also see entries for them here as well.
At this stage the diagnostics hub is utilizing a series of infosource DLLs to process all of the event data that was collected. It’s not something that you’ll have to worry about, but infosource DLLs essentially just compartmentalize processing of ETW data. For all the different tools available they can each examine the stream of ETW events to create some type of data model that we’ll later use for analysis. In the GPU usage case, we’re examining both thread and process context switches as well as GPU events to create a full picture of basic CPU utilization along with a detailed picture of what the GPU is doing at any point. These can be some very complex calculations involved here, in particular with figuring out how to correctly match up timings between when a DirectX event was triggered on the CPU side and when it was actually run on the GPU. Luckily for you, we take care of all this here at this stage for you.
User Interface
At this point all the work of collection and analysis is done and the job now is to expose all this information in the easiest to understand and navigate way as possible. As this part is the bulk of actually using our tool, I’ll just be covering it at a quick overview level now, and then diving in deeper in later blog entries.
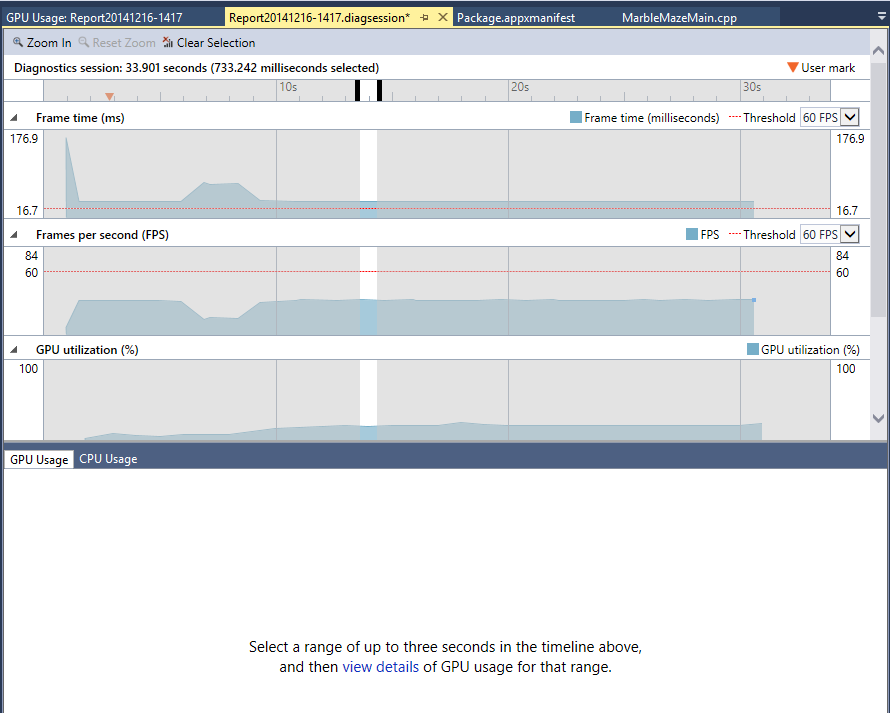
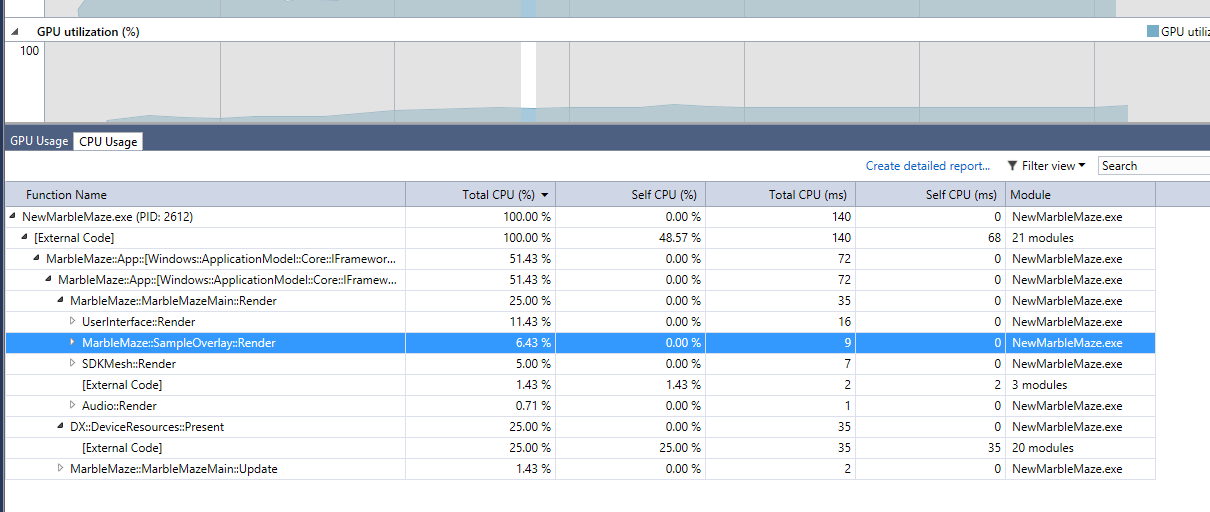
Above is the screen that you will see when analysis is first finished. It’s basically the same as information that you see when you were collecting on your running application. Consider this screen the index page in a book, it probably doesn’t have the information to solve your issue here, but it allows you to jump around in the data to find the section that does have that info. Also of note here is that if you selected multiple diagnostic tools to run with you will see other tabs at the bottom of the section here. Moving over to those tabs and you can see the information that was captured in them. For games that are suffering from slow CPU perf, turning on the CPU usage tool along with the GPU usage tool can be a powerful combination for getting both the CPU and the GPU better optimized.
From this main screen you can highlight a section of time by dragging to select it, then clicking the link on the lower part of the page will open up a details view of just that specific time slice. There will be a bit of a delay (based on file ETW density and amount of time selected) here as data is transferred to the new details page and the page is populated. One of the key limitations to understand here is that only three seconds or less can be selected in this view. This limitation is due to the GPU usage UI being designed around examining a detailed set of issues and not needing to scale out to look at multi second segments of time. However if you do want to make some comparisons between frames that are far apart in the log you can always open up as many instances of these details pages as you want at this point, so just open up a second details section the same way as the first and compare between the two.
The details page can be broken up into two main sections. On the top of the page is the timeline view. In this view, you will see a series of horizontal timelines with various blocks of color in them. Each timeline represents a single atomic resource that is could be consumed by a 3D game or application. For the CPU we show a lane for each CPU core, and for the GPU we show a lane for each engine. For those not familiar with the concept, GPUs can have multiple engines internally. While a game is running the 3D engine could be performing a DrawIndexed call overlapping the same time that the Copy engine is moving around some data with an UpdateSubResource call. However each CPU core or GPU engine can only be performing one task at one time, which is why they each get a unique lane entry in the timeline.
Regarding the colors, each process which has submitted any GPU work in the details time period selected gets its own unique color. Processes that just used CPU time are represented in the CPU Core lanes by a half-size black and white section. Up on the top of the timeline we have a filter box to select just one process at a time to focus on and which lists out all the various process / color combinations that can be seen in the chart. This per process information can be very important as the GPU resources can be in use by multiple processes at any one time, and it’s entirely possible that performance hitches in the game could actually be traced down to something like DWM.exe (the windows display process which uses DirectX) using some of the GPU resources that you hoped to have available.
At a basic level two of the most important things that this timeline can tell you are how your CPU and GPU resources are being utilized as well as how close / far you are from hitting your VSync performance goals. With regards to utilization, by looking at the CPU and GPU lanes you can get a quick idea as to if your game’s performance is CPU bound or GPU bound. If the GPU lane is relatively empty, with lots of spaces in it then your GPU is not being fully utilized and it is spending time waiting around for instructions to come from the CPU. If your GPU lane is packed full, and the CPU lanes are sparse, then the GPU is bogged down while the CPU sits and waits. Also on this chart you can see blue vertical lines that slice across all of the lanes. These lines represent the VSyncs of the monitor on your system. Also in the GPU line you can see some small text “P” icons, which indicate when a Present was triggered. Assuming a 60 FPS target and a 60Hz monitor you should see one “P” event in the GPU lane between each set of VSync lines. If a “P” comes after the lines, that means your rendering code missed its timing for that frame and your display is starting to lag.
Below the timeline is an event list. This list provides a text accompaniment to the visual timeline above. When you change selection in the event list the selection in the timeline will change, and visa-versa. The combobox and search filters at the top of the timeline control help to control the events that you’ll see in this list. So by combining those filters with the column sorting on the events list and you can answer some interesting questions. Like you could filter by “Draw” and sort by GPU Duration column in descending order to figure out the most expensive draw calls for a process in a time period.
A second feature of the event list is that in the default sorting mode it will place events into a hierarchy according to any DirectX event pairs detected in code. Having at least a small set of these markers in place is super important for getting the most out of the GPU usage tool. The issue here is that the data that we currently have does not allow for us to match up GPU events with a CPU callstack. As such when you see an expensive Draw call in a GPU lane you can’t directly tell which Draw call in your source code triggered it. Having your rendering code broken down by section allows you to attribute each DirectX call to a more specific section and to roll up performance data to a higher level, which is needed for anything but the most basic of applications.
That’s the basics of how the tool works. I’ll be digging in more with future blog posts, specifically around how to pick out common performance issues in the UI.


