5 minute tutorial on the amazingly easy to use MPI Cluster Debugger
The MPI Cluster Debugger (with C/C++ project templates) is now available via the Microsoft Download Center. Search for 'hpc debugger' or go directly to https://www.microsoft.com/downloads/details.aspx?displaylang=en&FamilyID=d3993532-bdf8-4024-b164-db2ee8a851f5
This package integrates the 'F5' experience of launching the Visual Studio 2008 MPI Cluster Debugger and your Windows HPC Server 2008 environment, for a better and more integrated debugging experience. This package provides a new tool window from which you can specify on which nodes the debugging will take place on the cluster. Once your break points are set and the debugger settings are specified you only have to press 'F5' to launch the debugger. Pressing 'F5' deploys your application binaries and the remote debugger, and submits a job to the scheduler. When the job is scheduled the MPI processes start under the control of the remote debugger.
Let's see how it works.
1. First download the package from the link above. Double click to install, then Launch visual studio. I assume you already have your Microsoft HPC 2008 SDK installed.
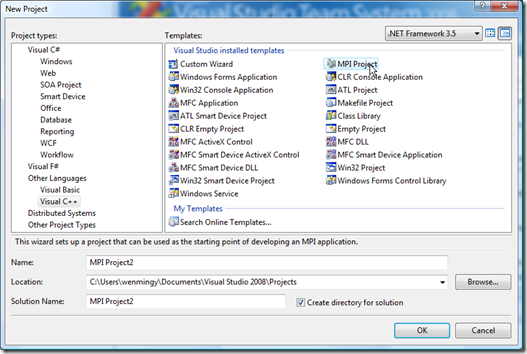
2. Click on new project, and navigate down to project type: Visual C++ , you will see an MPI Project listed in the template selection. Select it, and click on OK.
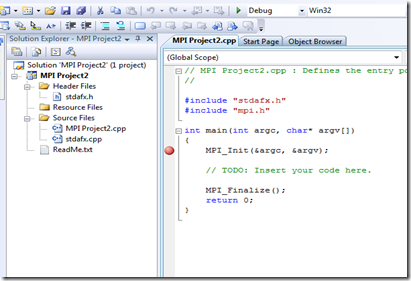
2. It will then create a default project for you with source code. Put a break point on the line where it says MPI_Init.
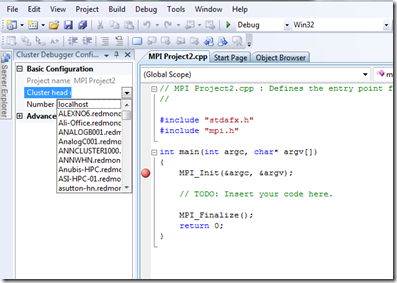
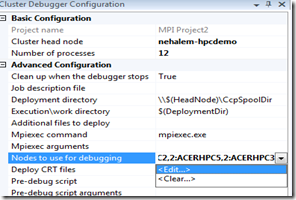
3. Configure the debugger by going to Tools Menu then select Cluster Debugger Configuration. You will now see the configuration details on the left side of the IDE window.
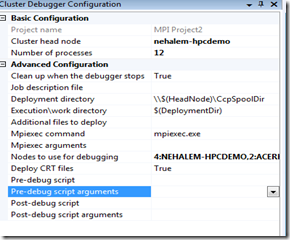
4. Next, select head node of the cluster that you want to run it on. Then, the number of processors, and make any changes to the advanced setting if necessary.
5. Edit the nodes you would like to use for debugging.
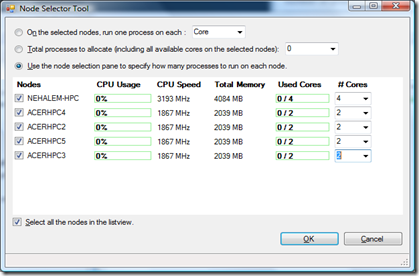
6. A dialog pops up allowing you customizing which nodes you would like to use. The CPU usages are displayed with live information.
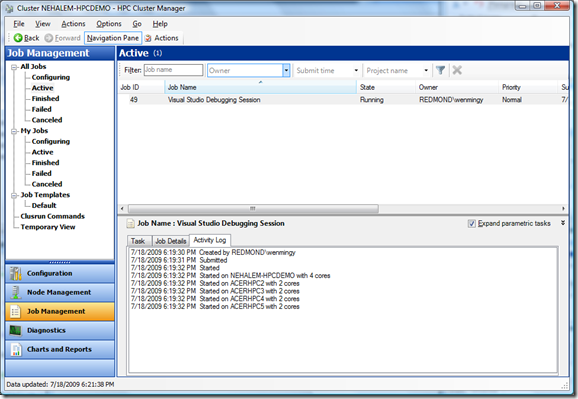
7. Now, the moment of truth... Press F5 to start debugging. Launch your HPC management console to observe whether the job is started on the cluster.
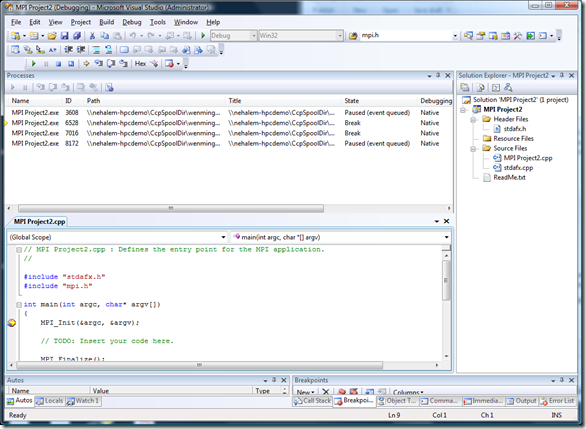
8. Back to visual studio window, click on Play, and you can see how the break point gets stopped at each launched MPI process that the debugger attaches to(total of 5), and run the job to completion.
This release of the cluster debugger real simplifies and streamlines the user experience in debugging MPI programs. Thanks for reading my blog.
UPDATE: For the Visual studio 10 beta description of the Debugger, please take a look at the MPI debugger Launch Integration channel 9 HPC SHOW by Daniel Moth.
UPDATE2: MSDN LINK to full documentation.
https://msdn.microsoft.com/en-us/library/ee945373.aspx
Comments
- Anonymous
July 20, 2009
Hey Wenming, This is so cool! Before I had to go out to each node, start up the remote debugger, copy out my program and data, and hope that I got everything right. Now it is so very easy to launch the debugger! Thanks! Robert
