Intro to Excel Services Data Sources
Introduction
The Excel Services Data Source in PerformancePoint 2010 allows you to create data using familiar Excel tools and methods that you can then surface in PerformancePoint scorecards.
To demonstrate the use of the Excel Services Data Source, I'll walk you through creating a scorecard that shows information about U.S. state government finance. The data for the this scorecard will be in an Excel workbook in a SharePoint document library.
My Example Workbook
For this example, I've created a sample workbook containing data about U.S. state government finances and population. The data in my workbook came from the site https://www.census.gov. I downloaded three workbooks from this site containing information about US state revenue, expense, and population in 2008. I consolidated this information into one workbook and then created a summary table called "StateFinances2008" containing simple metrics for each state like Revenue per Person and the Debt to Cash and Securities ratio. This workbook is attached to this blog post.
Saving the Workbook to SharePoint
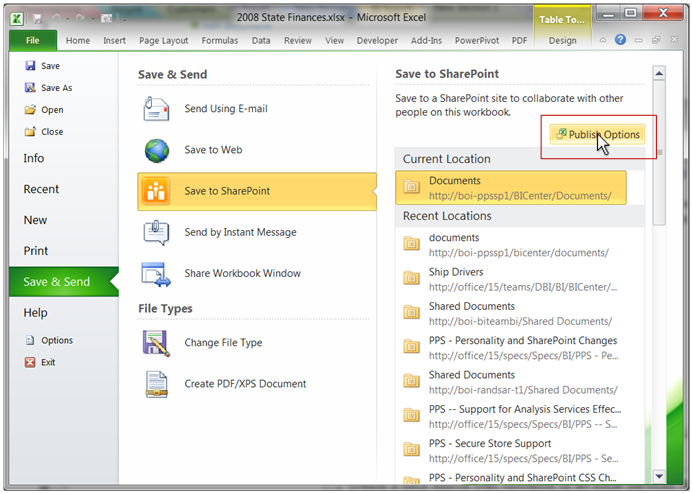
To use a workbook like the one I've created as a PerformancePoint data source, first save it to a SharePoint site with Excel Services enabled. To do this, use Save to SharePoint in Excel, setting the publishing options as described below.
Publishing options control which parts of the workbook are exposed though Excel Services. Publishing options are set using Publish Options as shown:
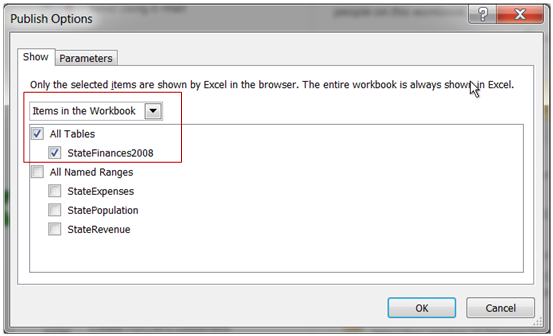
Expose only the StateFinances2008 data table by selecting it on the Show tab of the Publish Options dialog:
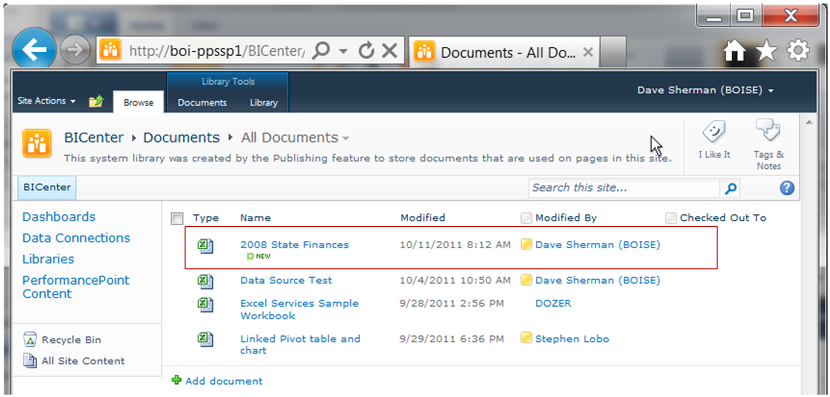
Here's the workbook in my BI Center document library:
Creating the Excel Services Data Source
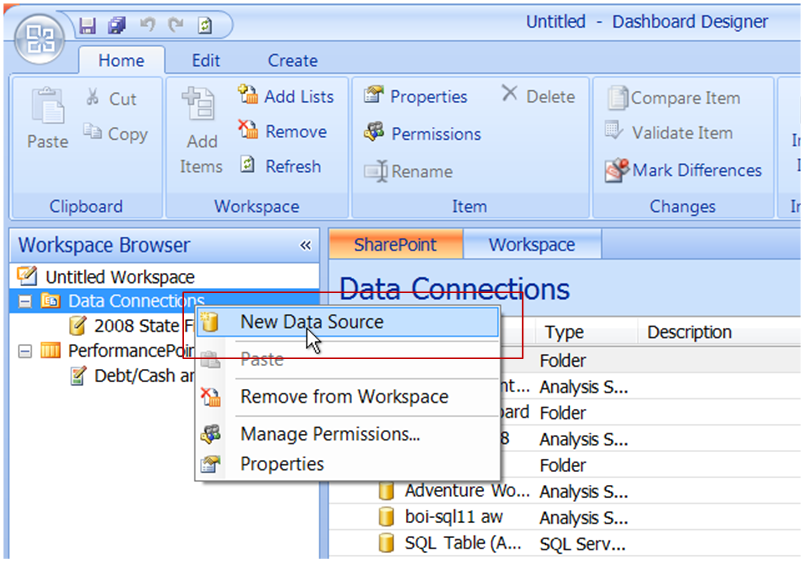
With the workbook in place, create a new data source using PerformancePoint Dashboard Designer:
When prompted to select the type of data source, choose Excel Services as shown:
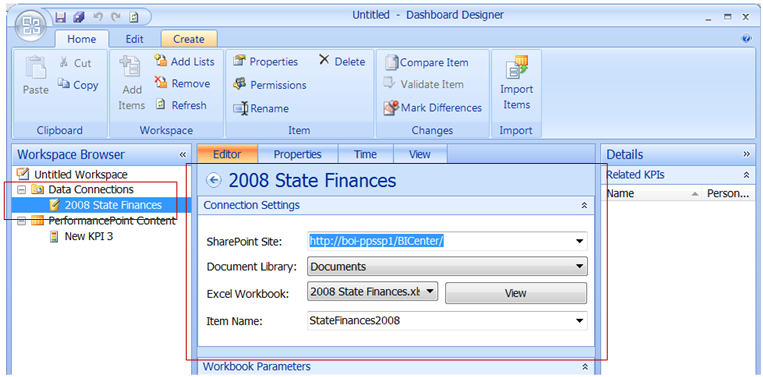
Once the data source is created, configure it to reference the workbook you saved to your SharePoint site. Supply all the information required to retrieve the desired information from the workbook: the site address, the document library name, the name of the workbook, and the name of the data table in the workbook. The following image shows this information for the data source I created:
Next, supply the names of the columns in your new data source. The column names aren't automatically copied from the data table in the workbook. To do this click on the View tab and then select each column and enter an appropriate column name in the Details pane on the right. Here's an image illustrating this process:
Once you've finished this, your data source is complete.
Using the Data Source
After the data source is in-place, creating KPIs and a scorecard that show data in the work book is straight-forward. Using the approach described in the post Creating simple budget KPIs from SharePoint Lists, you can create KPIs and a scorecard based on your new Excel Services data source. For my sample, I created three simple KPI:
| KPI | Actual (all from the Excel Services data source) | Target | Scoring Pattern |
| Revenue/Person | Revenue/Person | $5,000 | Closer to target is better |
| Expense/Person | Expense/Person | $5,000 | Closer to target is better |
| Debt/Cash & Securities | Debt/Cash & Securities | 0.25 | Decreasing is better |
I placed these KPIs on columns and put the State dimension from my Excel Services data source on rows with all states selected.
Here's a snapshot of the dashboard containing my scorecard:
Conclusion
Although this is a simple example, Excel Service data sources enable more sophisticated PerformancePoint solutions that leverage the power of Excel and Excel Services to retrieve, manipulate, and calculate data.
Dave Sherman | Senior Program Manger | Office BI
