Isolating SQL Performance Issues due to slow Disk IO subsystem
Hello all,
In this blog, we are covering few checklists to identify and isolate disk IO subsystem bottlenecks causing SQL performance issues. The checklist can be used as reference while troubleshooting SQL Performance issues because of slow Disk IO subsystem.
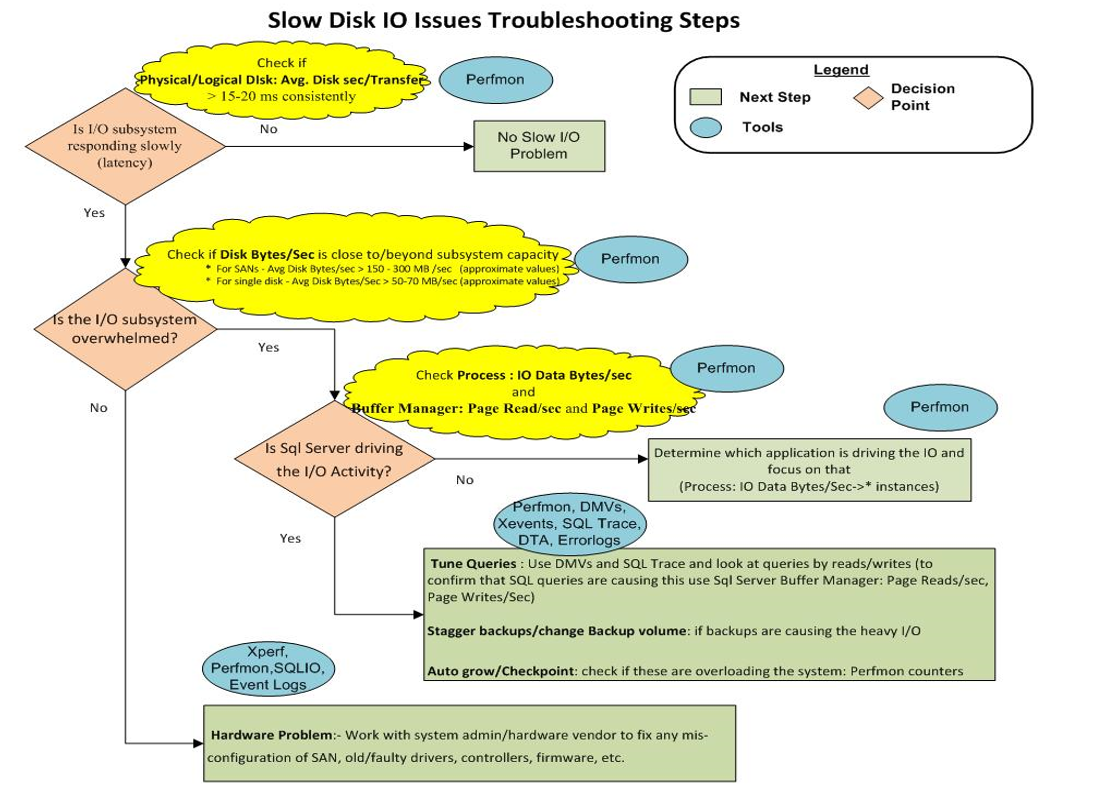
Below screenshot summarizes the approach to troubleshooting Slow disk IO issues:
Checklist for troubleshooting:
1.Check in SQL Server Error logs for "I/O requests taking longer than 15 seconds" warning message: SQL Server performance highly relies on the Disk performance. If the IO taking more than 15 seconds are reported frequently, its an indication of slow Disk IO subsystem.
SQL Server has encountered x occurrence(s) of I/O requests taking longer than 15 seconds to complete on file [Drive:\MSSQL\MSSQL.1\MSSQL\Data\xyz.mdf] in database [database]. The OS file handle is 0x00000000. The offset of the latest long I/O is: 0x00000000000000
2. Check through dynamic management views ( sys.dm_os_wait_stats, sys.dm_exec_requests) if the queries are having the below wait types. Below wait types indicate that the threads are waiting on IO completion.
PAGEIOLATCH_*
IO_COMPLETION
ASYNC_IO_COMPLETION
WRITELOG
BACKUPIO
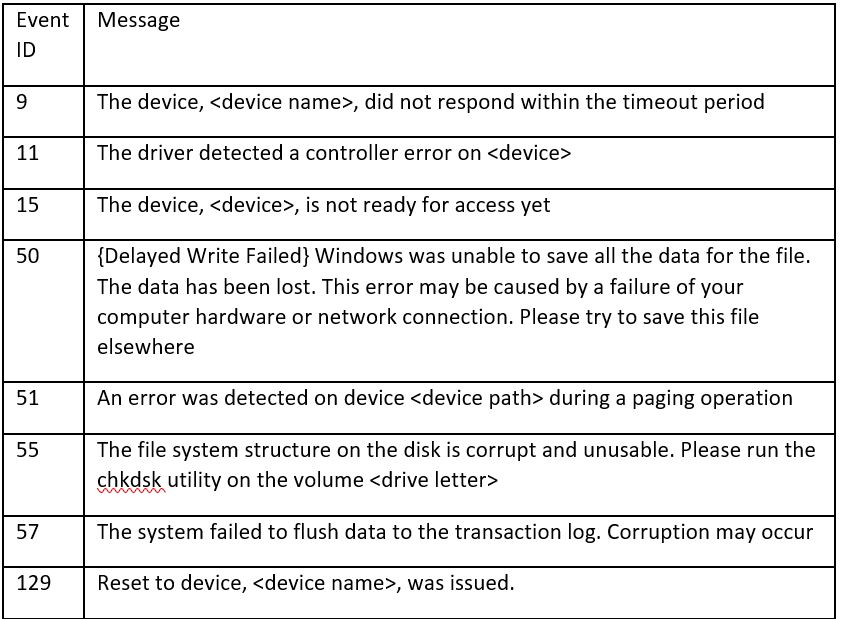
3. Review the Windows Event viewer system logs for NTFS related errors. Some common errors are listed below:

4. Windows Performance monitor tool (perfmon) is a great tool to review the Disk counters and isolate the slowness. Add the below counters for the drives hosting SQL database files.
LogicalDisk (Drive:)\Avg. Disk Queue Length >>>> should not be above 5.
LogicalDisk (Drive:)\Avg. Disk sec/Read
LogicalDisk (Drive:)\Avg. Disk sec/Transfer
LogicalDisk (Drive:)\Avg. Disk sec/Write
Benchmark:
< 0.005 excellent;
0.005 – 0.010 Good;
0.010 – 0.025 Fair;
> 0.025 Disk bottleneck
LogicalDisk (Drive:)\Disk Bytes/sec >>>>Above 300 MB/sec, need to be investigated.
If LogicalDisk (Drive:)\Disk Bytes/sec is 300 MB/sec, then load the below counters to check which process is throttling the IO subsystem.
Process(_Total) \IO Data Bytes/sec
Process(_Total) \IO Read Bytes/sec
Process(_Total) \IO Write Bytes/sec
Process(sqlservr)\IO Data Bytes/sec
Process(sqlservr)\IO Read Bytes/sec
Process(sqlservr)\IO Write Bytes/sec
If SQL Server is posting more IO compared to the total IO posted, then we need to focus on SQL queries which are posting high IO.
If SQL Server IO data bytes/sec is much less compared to total IO data bytes/sec, then load the counters for other processes and check which process is posting high IO.
To confirm SQL Server is doing a lot of reads/writes, look at below counters:
SQL Server: Buffer Manager: Page Read/sec
SQL Server: Buffer Manager: Page Writes/sec
If you see the values are more than 20,000 consistently, then clearly queries are driving the high volumes of data.
Please note that the above counters posted are for reference purpose only.
6. Check for any Flushcache messages in SQL Error log like below:
FlushCache: cleaned up xxxxxx bufs with xxxxx writes in xxxxx ms (avoided xxxxx new dirty bufs) for db x:0
average throughput: xx.xxMB/sec, I/O saturation: xxxxx, context switches xxxxx
last target outstanding: xx, avgWriteLatency xx
FlushCache is the SQL Server routine that performs the checkpoint operation. Post SQL Server 2012, if the above messages are posted in SQL Error log, then it’s in indication that long checkpoint operation on a database has exceeded the configured recovery interval.
Hope the above steps mentioned help you in troubleshooting Disk bottlenecks in SQL environment.
Please share your feedback, questions and/or suggestions.
Thanks,
Don Castelino | Premier Field Engineer | Microsoft
Disclaimer: All posts are provided AS IS with no warranties and confer no rights. Additionally, views expressed here are my own and not those of my employer, Microsoft.
