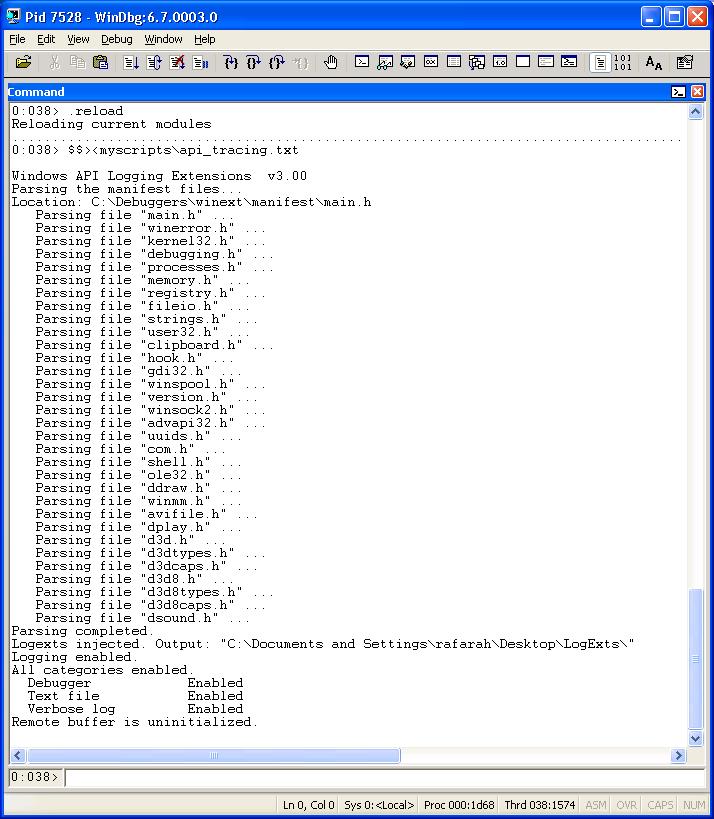
[Windbg Script] Tracing API calls
This is a very simple script, yet powerful script.
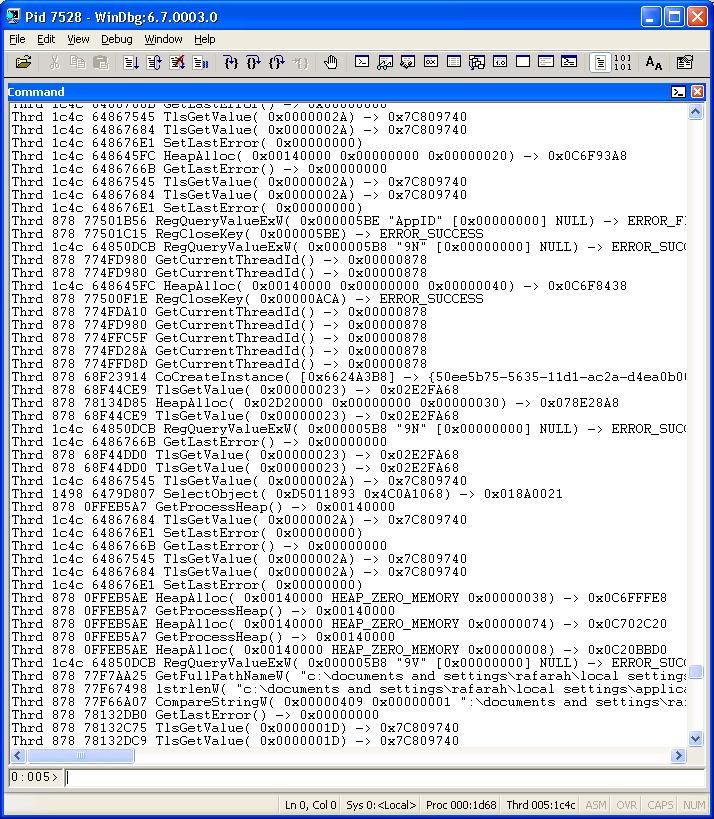
You can use it to see the APIs an application is using from your Windbg screen without using another tool. If you need more details from the APIs, just execute LogViewer.exe and open the .lgv file that is automatically created when you use this script.
Some screenshots:
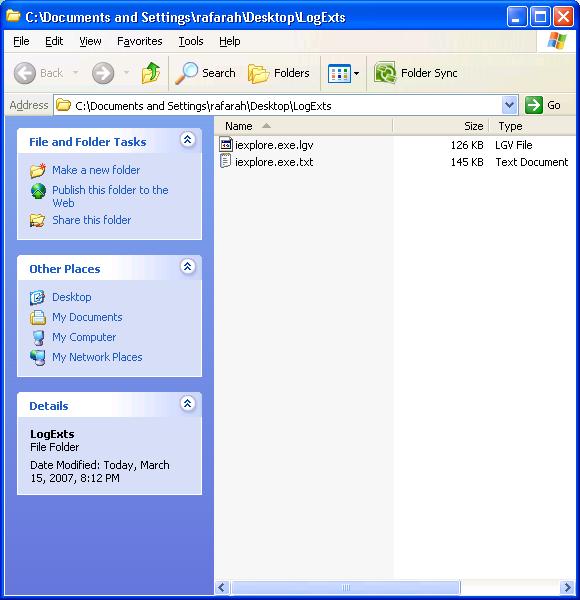
Output file, with .LGV extension:
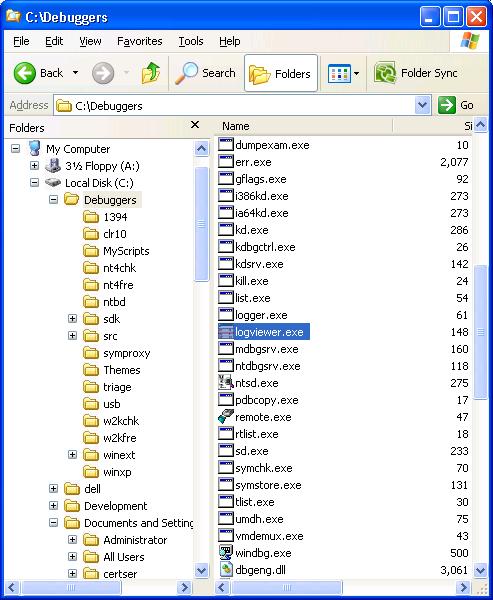
LogViewer.exe is part of Debugging Tools For Windows. It's in the same location you installed Windbg:
Opening the .LGV file using LogViewer.exe:
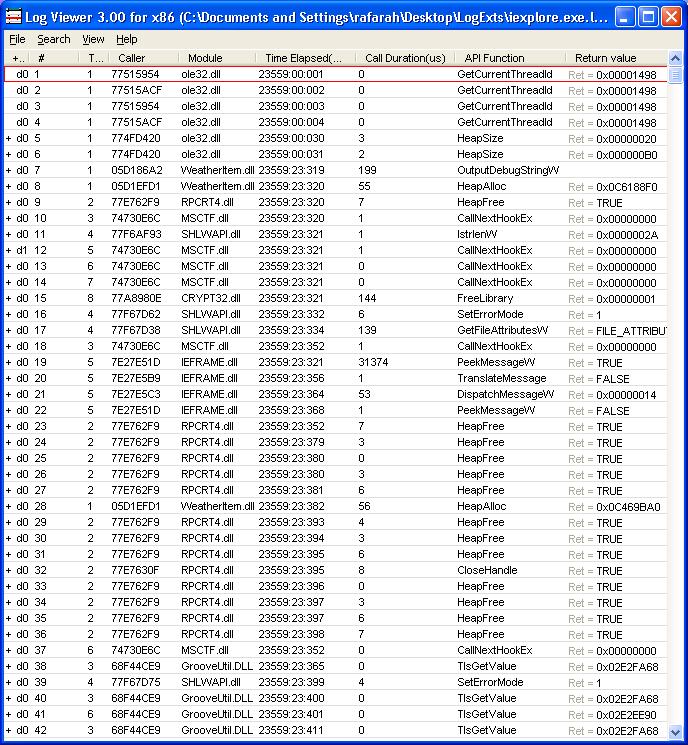
Source code for API_TRACING.TXT:
$$
$$ =============================================================================
$$ Trace APIs during the Debugging Session.
$$ Creates a log on Desktop and Windbg window.
$$ To see the more verbose log run logviewer.exe from Debugging Tools for Windows
$$ and open the file that has the .lgv extension.
$$ This file is inside LogExts on your desktop.
$$
$$ Compatibility: Win32, should work on Win64.
$$
$$ Usage: $$>< to run the program.
$$
$$ Roberto Alexis Farah
$$ Blog: https://blogs.msdn.com/debuggingtoolbox/
$$
$$ All my scripts are provided "AS IS" with no warranties, and confer no rights.
$$ =============================================================================
$$
!logexts.loge
!logexts.logc e *
!logexts.logo e v
!logexts.logb p
$$
$$ ====================================
$$ Logging is enabled for this process.
$$ ====================================
Comments
Anonymous
May 01, 2007
Hi Roberto, Another useful tips. I didn't know of those commands. Instead of running the script, I just executed the commands in the order as follow: !logexts.loge !logexts.logc e * !logexts.logo e v !logexts.logb p I can see that the lgv file was created with contents. However, when I used LogViewer to open the lgc, it doesn't shown me the info as you have on the post. Anything I did wrong ? ThanksAnonymous
May 01, 2007
Hi nativecpp, It's good to read your comments again!:) Let me ask you something: Did you use the FileOpen option and selected the .LGV file? I just want to be sure because if you just open LogViewer.exe it won't show you the content, you need to specify the .LGV file. Another question, inside your LogExts folder, is there a .TXT file? It should be and it should have content. Thanks.Anonymous
May 01, 2007
Yes. I used File/Open. But my .TXT does exist but with 0 byte. :-(( May be that's why it shows nothing.Anonymous
May 01, 2007
The comment has been removedAnonymous
May 02, 2007
I think I did. But I would try again. BTW, I thought with Tess mentioning your blog, I would expect much more traffic than what I am seeing :-)) At any rate, I like your blog. I have never explored those commands you have posted so far. Keep up the good work.Anonymous
May 02, 2007
Actually the number of users reading the blog is constantly increasing but I've been receiving more e-mails related to script programming questions than comments. :)Anonymous
May 02, 2007
The comment has been removedAnonymous
May 02, 2007
Hi, I don't know what it is... try to run logger.exe notepad.exe, it does the same thing as my script but without using Windbg. Let's see if the results are consistent. I tried to reproduce the symptom here, but I couldn't, it worked here and from my home computer, too. :) Another thing you may want to try. Download the latest Windbg version: http://blogs.msdn.com/dougste/archive/2007/05/01/new-preview-release-of-windbg-available-6-7-5.aspx and try the script using it.Anonymous
May 03, 2007
Hi, I think I know what happened. I did NOT run logger.exe :-((. Now, Can you tell me the order ? Do I run logger.exe notepad.exe first before I run windbg and attach notepad.exe ? ThanksAnonymous
May 03, 2007
Logger.exe does the same thing the script does. It's just another approach. So, I understand using logger.exe it works, using the script it isn't working for some reason. However, as the logger.exe is running the problem is possibly related to the extension. Have you tried to upgrade the debugger? Just to eliminate possibilities.Anonymous
May 03, 2007
Hi, I had never used logger.exe before. But I am confused. I did the follwing:
- logger.exe wordpad.exe
- After a few min., I closed the logger.
- Open the logviewer.exe and I can open the .lgv. and see in grid format as shown in your post. But the .txt is still 0 bytes.
Anonymous
May 03, 2007
BTW, my windbg version is 6.6.0007.5 which I updated when I first tried your script. ThanksAnonymous
May 03, 2007
When using logger.exe it doesn't create the text file. The text file is created when running the Windbg script. So, at this point, we know logger.exe is working as expected. Now, please, try it: 1- Open notepad.exe 2- Open Windbg. 3- Attach Windbg to Notepad.exe 4- Run the script using $$>< 5- Press "g" 6- Type something on Notepad, finish the instance and use .logclose in Windbg, then close Windbg. 7- Check if two files were created in your logexts folder and try to open the .LGV file using LogViewer.exe ThanksAnonymous
May 04, 2007
Hi Roberto, It still does NOT work. I executed the command one at a time w/o using the script file. I noticed the following: 0:001> !logexts.logb p Remote buffer is uninitialized. May be that's why it didn't have any content ? ThanksAnonymous
May 04, 2007
Hi nativecpp, The message is correct. Let me show you my Windbg output window on Windows XP SP2: First I attached Windbg to a Notepad.exe instance. Then I ran the script: 0:001> $$><myscriptsapi_tracing.txt Windows API Logging Extensions v3.00 Parsing the manifest files... Location: C:Debuggerswinextmanifestmain.h Parsing file "main.h" ... Parsing file "winerror.h" ... Parsing file "kernel32.h" ... Parsing file "debugging.h" ... Parsing file "processes.h" ... Parsing file "memory.h" ... Parsing file "registry.h" ... Parsing file "fileio.h" ... Parsing file "strings.h" ... Parsing file "user32.h" ... Parsing file "clipboard.h" ... Parsing file "hook.h" ... Parsing file "gdi32.h" ... Parsing file "winspool.h" ... Parsing file "version.h" ... Parsing file "winsock2.h" ... Parsing file "advapi32.h" ... Parsing file "uuids.h" ... Parsing file "com.h" ... Parsing file "shell.h" ... Parsing file "ole32.h" ... Parsing file "ddraw.h" ... Parsing file "winmm.h" ... Parsing file "avifile.h" ... Parsing file "dplay.h" ... Parsing file "d3d.h" ... Parsing file "d3dtypes.h" ... Parsing file "d3dcaps.h" ... Parsing file "d3d8.h" ... Parsing file "d3d8types.h" ... Parsing file "d3d8caps.h" ... Parsing file "dsound.h" ... Parsing completed. Logexts injected. Output: "C:Documents and SettingsrafarahDesktopLogExts" Logging enabled. All categories enabled. Debugger Disabled Text file Disabled Verbose log Enabled Remote buffer is uninitialized. After that, the "g" command to transfer control to Notepad: 0:001> g ModLoad: 50000000 5004a000 C:Debuggerswinextlogexts.dll Parsing the manifest files... Location: C:Debuggerswinextmanifestmain.h Parsing file "main.h" ... Parsing file "winerror.h" ... Parsing file "kernel32.h" ... Parsing file "debugging.h" ... Parsing file "processes.h" ... Parsing file "memory.h" ... Parsing file "registry.h" ... Parsing file "fileio.h" ... Parsing file "strings.h" ... Parsing file "user32.h" ... Parsing file "clipboard.h" ... Parsing file "hook.h" ... Parsing file "gdi32.h" ... Parsing file "winspool.h" ... Parsing file "version.h" ... Parsing file "winsock2.h" ... Parsing file "advapi32.h" ... Parsing file "uuids.h" ... Parsing file "com.h" ... Parsing file "shell.h" ... Parsing file "ole32.h" ... Parsing file "ddraw.h" ... Parsing file "winmm.h" ... Parsing file "avifile.h" ... Parsing file "dplay.h" ... Parsing file "d3d.h" ... Parsing file "d3dtypes.h" ... Parsing file "d3dcaps.h" ... Parsing file "d3d8.h" ... Parsing file "d3d8types.h" ... Parsing file "d3d8caps.h" ... Parsing file "dsound.h" ... Parsing completed. Then I type something in Notepad and close Notepad after some typing. The control goes back to Windbg: eax=0007f284 ebx=00000000 ecx=00000001 edx=00000000 esi=7c90e88e edi=00000000 eip=7c90eb94 esp=0007fbe8 ebp=0007fce4 iopl=0 nv up ei pl zr na pe nc cs=001b ss=0023 ds=0023 es=0023 fs=003b gs=0000 efl=00000246 ntdll!KiFastSystemCallRet: 7c90eb94 c3 ret And I close Windbg. notepad.exe.txt is created and has 0 bytes. No problem here! We are not worried about this file. Actually, above I mentioned it should have content. My mistake, do not consider this file, it's not relevant here. In my case, notepad.exe.lgv is created and has 1,192kb. Now I use logviewer.exe to open notepad.exe.lgv Please, verify if executing the script you have the same output shown above. ThanksAnonymous
May 04, 2007
It works :-)) May be I did something wrong earlier. Thanks Question on Logger: Can I use logviewer.exe to see the content while running Windbg ? May be that was what I did :-((Anonymous
May 04, 2007
Cool! :) To run the logviewer.exe you need to stop logger.exe or stop the script. You cannot use logviewer.exe "on the fly" as you tried. Anyway, the script shows you the API's being called on the fly. ThanksAnonymous
July 05, 2007
Hi! Is it possible to trace API calls in static (not started) code? Best regards MattAnonymous
July 06, 2007
Hi Matt! There may be have some tools that do that. Anyway, one approach that I know is to use the DumpBin.exe/Linker.exe utility and look for imported API calls. Here are some related links: http://www.microsoft.com/technet/prodtechnol/acs/proddocs/accrsc_hiisexe.mspx?mfr=true http://en.wikibooks.org/wiki/Reverse_Engineering/Other_tools#PE_File_Header_dumpers http://en.wikibooks.org/wiki/Reverse_Engineering/Dynamic_Libraries I hope it helps.Anonymous
August 07, 2007
Hi Roberto I saw sam problem and I found what is the problem
- run notepad.exe
- run script
- view log <- fail
- terminate notepad.exe
- view log <- success scriptor have to terminate application Thanks.
Anonymous
August 08, 2007
Hi Taehwa, I think you had problems because the log is still being used by the application and the output may not be flushed to disk. Try to do that: After running the script for a while, use this command: !logexts.logd It will disable logging. Then try to view the log file.Anonymous
August 09, 2007
Hi Roberto I used that command !logexts.logd but I still can't view the log file. I think WinDbg still being used the log file. Thanks.Anonymous
August 10, 2007
Hi Taehwa, I just did some tests and there's no way to see the lgv file when the application is running, like you told me. However, I have a workaround for you: you can use .logopen pathfilename, then call the script, then use .logclose when you finish the debugging session. During the debugging session you can open the log file created by .logopen or use an application that reads this log. I hope it helps you.Anonymous
October 16, 2007
Hi, Roberto Farah. Please explane, why logexts could't trace user32.dll functions such as CreateWindow (CreateWindowExA, CreateWindowExW). I set !logc e * in trace options, but tracing list contain only kernel32.dll exported functions such as LoadLibrary, GetProcAddress, etc.Anonymous
November 05, 2007
Hi BadBug, Are you using public symbols? If you are not using public symbols then you are not going to be able to see the modules.Anonymous
May 22, 2008
Anyway to trace non win32 functions like prop code? cheers redAnonymous
May 22, 2008
Yes, but using another approach. Assuming you have symbols for your proprietary code you can set a breakpoint in all methods/functions for each proprietary method like: bm module!* "command" In "command" you may try this approach that I haven't tested yet: bm module!* "ln @eip" Because eip is pointing to the very next instruction the "list nearest" symbol should show you the function name. Or, if you want something more sofisticated you can use PowerDbg and create a script that parses the output of: x module!* And use the method/function name as argument fo bp module!parsedMethod ".echo parsedName was called" Does it make sense to you?Anonymous
September 03, 2008
http://blogs.msdn.com/debuggingtoolbox/archive/2007/04/14/windbg-script-tracing-api-calls.aspx 글 : RobertoAnonymous
December 21, 2009
Hi Roberto, When I try to using this script to tracing a little complex program which used COM Interfaces, WinDbg got some error.. Parsing file "d3d8types.h" ... Parsing file "d3d8caps.h" ... Parsing file "dsound.h" ... Parsing completed. [LogHookComInterface] Interface {a39ee748-6a27-4817-a6f2-13914bef5890} is unknown -- not logging. [LogHookComInterface] Interface {000214ea-0000-0000-c000-000000000046} is unknown -- not logging. [LogHookComInterface] Interface {000214e3-0000-0000-c000-000000000046} is unknown -- not logging. ..... many like above and below [LogHookComInterface] Interface {000214e3-0000-0000-c000-000000000046} is unknown -- not logging. [LogHookComInterface] Interface {000214ea-0000-0000-c000-000000000046} is unknown -- not logging. [LogHookComInterface] Interface {6e89f8e2-9a2a-4797-9b91-41146bdf0e7b} is unknown -- not logging. LOGEXTS ERROR: [LogProcessHook] 'KERNEL32.DLL!SetFilePointerEx' stack usage expected to be 4 but was 5. (1720.1150): Break instruction exception - code 80000003 (first chance) eax=0012ab54 ebx=00000000 ecx=7c85b008 edx=5003ad00 esi=10eed6c0 edi=3e4c1ab0 eip=500148d7 esp=0012ae18 ebp=0012ae20 iopl=0 nv up ei pl nz na pe nc cs=001b ss=0023 ds=0023 es=0023 fs=003b gs=0000 efl=00200206 logexts!LogDbgPrint+0xe7: 500148d7 cc int 3Anonymous
December 23, 2009
Here is my suggestion: use logger.exe/logviewer.exe that are in the same directory where your debugger is installed and see if you can get more details. With logger.exe you'll see an user interface where you can select the APIs to be tracked and kernel32 should be excluded by default. Let's see if you can get more details or better results using logger.exe since you have more control than using the script.Anonymous
November 26, 2010
Hi, Roberto. Don't you know why api logging doesn't work? It just creates .lgv files about 17kb and some empty .txt file with the same name?Anonymous
January 07, 2011
Hi sulacco, Sorry I missed your comment. Try to use the logger/logviewer instead of using the script and see if the results are consistent. Also make sure you are using the latest debugger version. ThanksAnonymous
April 12, 2014
Hi, kernel32.dll is mandatorily excluded here. Is there any way to log kernel32.dll functions too?Anonymous
April 21, 2014
Hi Anusha, using the extension the kernel32.dll is excluded like you mentioned: !logexts.logm Displays or creates a module inclusion/exclusion list. It is often desirable to only log those API calls that are made from a certain module or set of modules. To facilitate that, Logger allows you to specify a module inclusion list or, alternatively, a module exclusion list. For instance, you would use an inclusion list if you only wanted to log calls from one or two modules. If you wanted to log calls made from all modules except a short list of modules, you would use an exclusion list. The modules Logexts.dll and Kernel32.dll are always excluded, since Logger is not permitted to log itself. msdn.microsoft.com/.../ff560170(v=vs.85).aspx However, using logger.exe you can overcome this limitation including kernel32 but excluding the dll from Logger.exe. Notice that I have not tried to do that by myself, but I think it should work, so let me know the outcome please :-)
