Advanced tracking with Logic App and Integration Account
Operating at scale
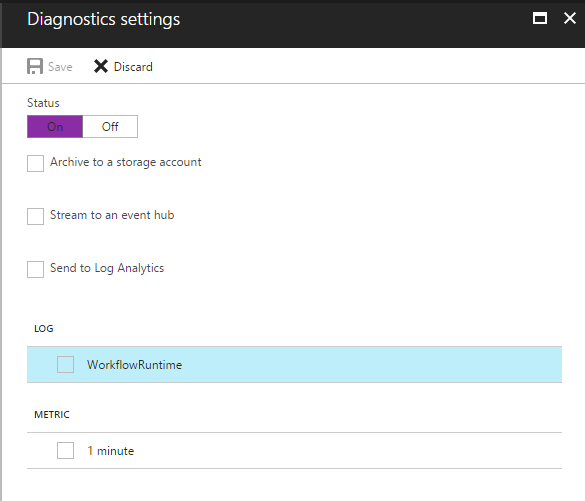
Once your integration solution with Logic App reach a certain scale and complexity, the vanilla Azure Management Portal, Logic App run history, albeit capable, is not quite powerful enough for IT engineers to service the solution efficiently. It is then time to enable the diagnostics on the Logic App to generate 'WorkflowRuntime' log events which first you can use for alert rules right there in the Azure Management Portal but which also importantly enables to export events to Azure Operations Management Suite (OMS) aka Log Analytics

The Diagnostic logs under the Monitoring section of the Logic App tile will then light up. A link to the configured Log Analytics will bring you to both in the management portal Log Search as well as the OMS portal where you can enable easily designed custom reporting or turn on purpose-built solutions. Best of all the whole service is free for up to 500 MB per day and beyond that a very reasonable $2.30 per GB if you upgrade to paid service (pricing may change, see current pricing information here).
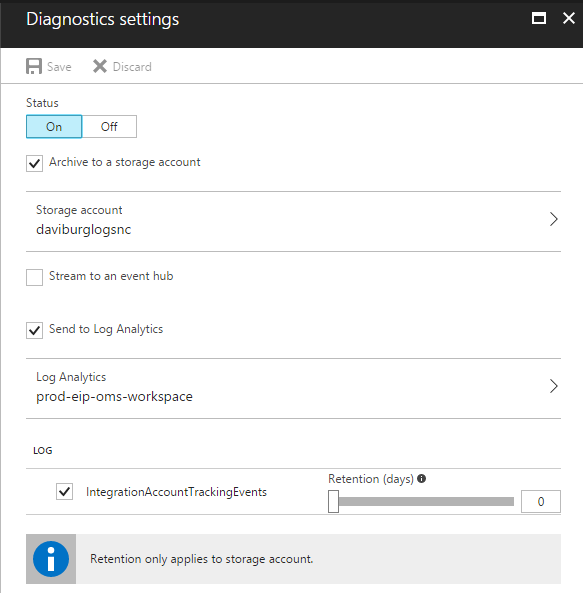
For those using B2B connectors - AS2, X12, EDIFACT -, you will greatly benefit from enabling diagnostics on the Integration Account associated with the connectors. 
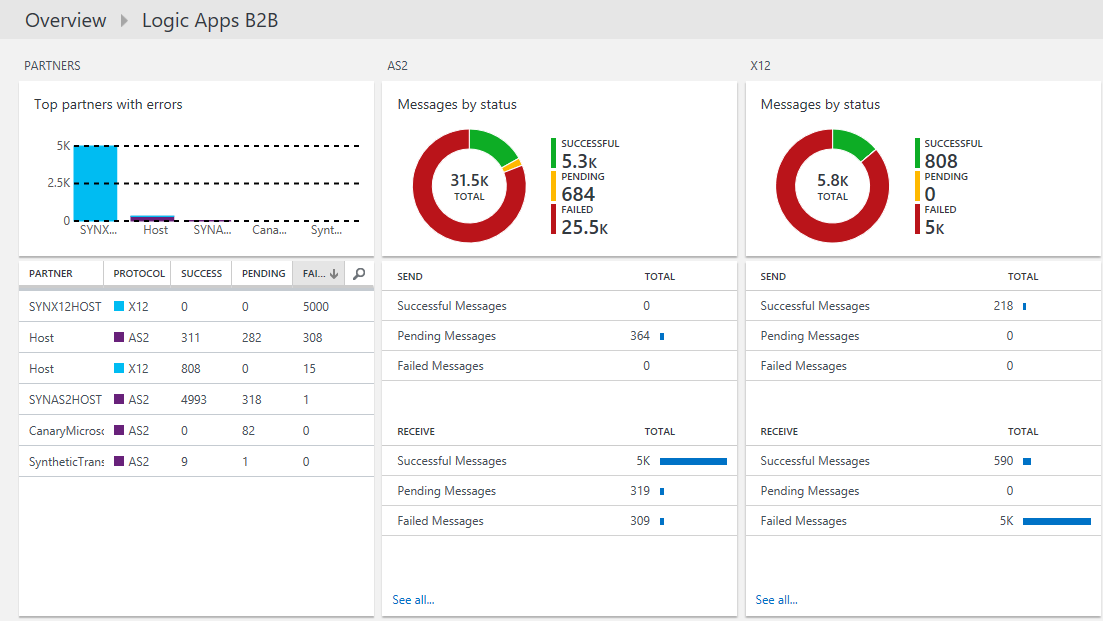
There is a dedicated OMS solution for rich analysis of the generated tracking data, to be found in the Solutions Gallery:

See more on the Azure documentation for Tracking B2B messages in OMS.
Going custom
Tracked Properties
From within the Logic App you have a simple, quick way of feeding custom tracking data into the diagnostics stream: tracked properties. This is documented in the third part of this section “Azure Diagnostics Settings” and in particular “Tracked properties”:
/en-us/azure/logic-apps/logic-apps-monitor-your-logic-apps#azure-diagnostics-and-alerts
This works only for content you can express in the Logic App workflow definition language. These tracked properties will be added to the WorkflowRuntime log (as opposed to the IntegrationAccountTrackingEvents for B2B connectors and custom tracking events below).
Custom tracking events
The Integration Account custom tracking events have be to be used if calling from outside the Logic App. And pause for a moment - that's a very powerful thing when you think about the services and applications you may have surrounding your logic app. Imagine for instance that you had a custom store-and-forward service at the edge of your enterprise solution which capture everything going in and out for redirection, load balancing, buffering, troubleshooting and replay scenarios - you can now emit tracking events from that service to the same store as your Logic, as your B2B connectors and include correlation ids to tie the whole flow together across heterogeneous services. Same for your Line-Of-Business application at the core of your solution, you can also emit correlated events from there.
Within the Logic App you have a choice between the simpler LA tracked properties and the more capable Integration Account custom tracking events. If you write your own connector code, it will be more efficient to call Integration Account custom tracking events directly than to do an HTTP action to call the Integration Account - this is what the B2B connectors internally do.
The Integration Account custom tracking events follow a Json schema documented at:
With a custom record type as JToken, you can track in a single call all the properties you want for an action, following a structure that you define, instead of declaring one-by-one each property as in the Logic App definition language for promoted properties. Also notice that the API takes an array of events such that in a single call an event source can log tens of events with that single network trip. For high throughput connectors like B2B, this enabled to keep a verbose tracking output detailing and organizing information at all levels of the protocol - Interchange, Functional Group and individual Transaction Sets plus each of the matching Acknowledgement messages, generated or received.
With your custom payload you call the tracking API on the Integration Account. The relative URI to track events is /logtrackingevents
This needs to be appended to the Integration Account callback URL.
[caption id="attachment_296" align="alignnone" width="1610"]![]() An example of calling tracking API on Integration Account using Postman[/caption]
An example of calling tracking API on Integration Account using Postman[/caption]
The method is POST, the URL is the integration account’s callback URL where you add the /logtrackingevents method suffix after the integration account id and before the query string parameters (?api-version…).
The one header you need to have is {"Content-Type":" application/json; charset=utf-8"}
One optional thing missing at the time of writing this blog post in the MSDN article for the event schema is that at the same level as the “recordtype” and “record” you can have an “error” field containing a “message” and “code” both of type string. This is most relevant when you want to track your custom error events on which you can write specific alert rules. Then it is most efficient with unique error code per live site support situation you anticipate, as you can use the unique error code to trigger specific automated remediation steps or to point operators to specific manual remediation steps/scripts.
Troubleshooting development issues with custom tracking
Here are some of the error you might run into while trying to post for the first time to the tracking API:
Error code: 401 Unauthorized
Body:
{
"error": {
"code": "AuthorizationFailed",
"message": "The authentication credentials are not valid."
}
}
=> Error in the authorization query string parameter (e.g. typo, incomplete copy-paste, etc.)
Error code: 415 Unsupported Media Type
Body:
{
"error": {
"code": "UnsupportedMediaType",
"message": "Unsupported media type."
}
}
=> Content-Type header is not set to application/json; charset=utf-8
Error code: 404 Not Found
Body:
{
"message": "No HTTP resource was found that matches the request URI 'https://<foobar>'."
}
=> The URI relative path is incorrect. For instance you have not added the necessary /logtrackingevents suffix after the integration account GUID and before the query string parameters which start with ?api-version=
=> Or, the HTTP verb is incorrect. Use POST (not PUT).
Comments
- Anonymous
January 08, 2018
Please see also the following more recent work on tracked properties by my colleague Sumit Kumar explained in a detailed blog post here, including detailed steps:https://blogs.msdn.microsoft.com/logicapps/2017/11/03/monitor-logic-app-action-inputsoutputs-in-log-analytics-oms-using-tracked-properties/ - Anonymous
January 08, 2018
A few limits to be aware off shared by Abhishek who has used tracked properties successfully:1. There is limitation (500) on number of columns. That means if your column/tracked properties count go beyond that, you will not find any information logged.2. There is limitation on text data (16000 chars) per column. If any of your column has more data, information will not be logged.3. If you switch between designer and code view (from code view to designer) and save, tracked properties related code gets wiped out and you will not find any information logged.1. and 2. are limitations for performance and scale reasons, so enormous single events are not choking the eventing system that handles potential very large amount of events. Likely there is some application design to reconsider if you end up pushing enormous events.3. is a known issue in the designer for which our Logic Apps team has a pending work item. - Anonymous
June 20, 2019
This blog has been moved off the MSDN platform. Find further content and update at https://www.linkedin.com/today/author/daviburgComments are locked as part of the blog migration, so please reach out to your customer support contact for assistance with Microsoft products and services.