Session Loss due to Application Domain Recycle-Advanced
In the previous blog we were discussing about the basics of app domain recycling and the steps we can take to confirm if app domain recycling is happening. We might come across a situation where from the steps explained previously we will come to know that app domain recycling is happening but we are not sure what triggered the app domain recycling. In this blogs we will discuss about the advanced debugging techniques to identify that.
Below are some of the data that we need to collect.
Steps to collect Procmon:
1. Download process monitor from https://technet.microsoft.com/en-us/library/bb896645.aspx
2. Run procmon.exe
3. Wait till the issue reoccurs and after the issue reoccurrence please stop the trace.
Note: Process monitor collects all the system level events and a lot of data. Even though this is a very good trace, if the issue you are facing is very intermittent avoid going for procmon data collection as this might consume more space and cause disk space issues. |
Steps to Create Debug Diag Rule:
1. We will use Debug Diagnostic 2.0 update 2 version to troubleshoot this issue further. Please install the Debug Diagnostic 2.0 update 2 tool fromhttps://www.microsoft.com/en-us/download/details.aspx?id=49924 (Please un-install all other versions of Debug Diagnostic tool before installing the latest version)
2. Before proceeding with the rule creation we need to download the symbols needed for the automated rule creation. Take the below steps to download the symbols for your w3wp process.
a. Download PDBDownloader.exe from https://github.com/rajkumar-rangaraj/PDB-Downloader/releases b. Run the PDBDownloader.exe and click on open files c. If the application we are creating the rule for is a .Net 2.0 64 bit app, Navigate to the path C:\Windows\Microsoft.NET\Framework64\v2.0.50727\ and select mscorwks.dll. Click on Start d. If the application we are creating the rule for is a .Net 2.0 32 bit app, Navigate to the path C:\Windows\Microsoft.NET\Framework\v2.0.50727\ and select mscorwks.dll. Click on Start e. If the application we are creating the rule for is a .Net 4.0 64 bit app, Navigate to the path C:\Windows\Microsoft.NET\Framework64\v4.0.30319\ and select clr.dll. Click on Start f. If the application we are creating the rule for is a .Net 4.0 32 bit app, Navigate to the path C:\Windows\Microsoft.NET\Framework\v4.0.30319\ and select clr.dll. Click on Start g. The tool will download the public symbols of mscorwks.dll or clr.dll to C:\Symbols folder and we are good to proceed with the rule creation |
Note: The executable requires internet connection to download the symbols. If you don’t have internet connection on the server, then copy the dll specific to your framework and bitnessto the machine which has internet connection and run the tool over there. Once you have the symbols downloaded, copy PDB file to the server’s symbol folder. In case of Debug Diag 1.2 or Debug Diag 2.0 Update 1copy it to C:\Symcache, else use C:\Symbols |
| Debug Diag 2.0 Update 2 uses the symbol folder as C:\Symbols. Debug Diag 1.2 or Debug Diag 2.0 Update 1 uses the symbol folder as C:\symcache. If you have Debug Diag 1.2 or Debug Diag 2.0 Update 1 then change the file location in PDBDownloader.exe to C:\symcache. If folder does not exist please create it. |
3. Create a Crash Rule in Debug Diagnostic 2.0 with the following steps:
a. Open DebugDiag (Start -> Programs -> Debug Diagnostic Tool 2.0 Collection)
b. Select "Crash" and click Next
c. Choose the option A specific IIS application pool and click Next and choose the application pool that is crashing from the list and click Next. (Note: The Application pool list may be empty if the IIS 6 Metabase Compatibility is not installed. In such a case you can always type the name of the application pool and click Next)
e. Click Next in Advanced Configuration (Optional), click on Breakpoints and then click on Add Breakpoint
f. If it is a .net 4.0/4.5 app then Add clr!AppDomainNative::Unload and change the Action Type to Full User Dump and Action Limit to 5 and click on Ok. If it is a .net 2.0/3.5 app then Add mscorwks!AppDomain::UnloadWait and change the Action Type to Full User Dump and Action Limit to 5 and click on Ok.
g. Select Action Type as Full User Dump.
h. Click on Save and Close
i. Click Next for "Rule Name". The "User dump Location" can be changed here.
j. Select "Activate the rule now" and click Finish
3. Notice the Status is Active. The User dump Count will increase each time a dump file is created.
4. Wait for the issue to happen.
If everything goes well you will process monitor trace and the process dump at the time of the issue.
How to analyse process monitor trace?
As we had discussed earlier we know that application domain recycles whenever there is some change to either the framework directory or to your application directory. So we will be interested to look what exactly is getting changed at the time of the issue and who is the culprit doing it.
I will show you some of the shortcuts that you can use to analyse this trace.
As I said most likely we will be interested in the writes to any directory.
Step 1: Go to Tools->Count Occurrences->Select Operation and then click on Count.
Step 2: We will be interested in WriteFile as below. Click on Filter. Click on close.
Step 3: Next we are interested in changes to either the framework directory or application directory. Go to Filter->Filter.
 |
Step 4: In the first drop down select Path and in second drop down select contains and in the 3 text box, type in your application directory. For example in my case it would be C:\inetpub\wwwroot\TestUserIdentity452. Click on Add
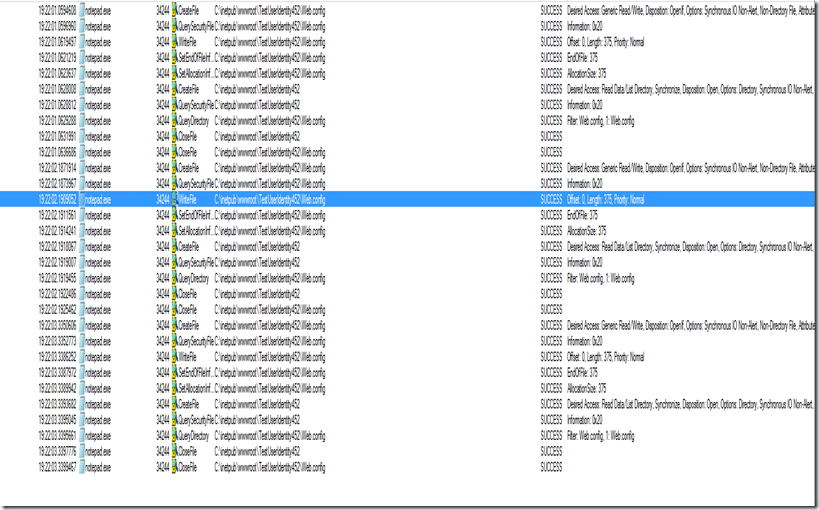
Step 5: You will get a list of write file attempts as below.
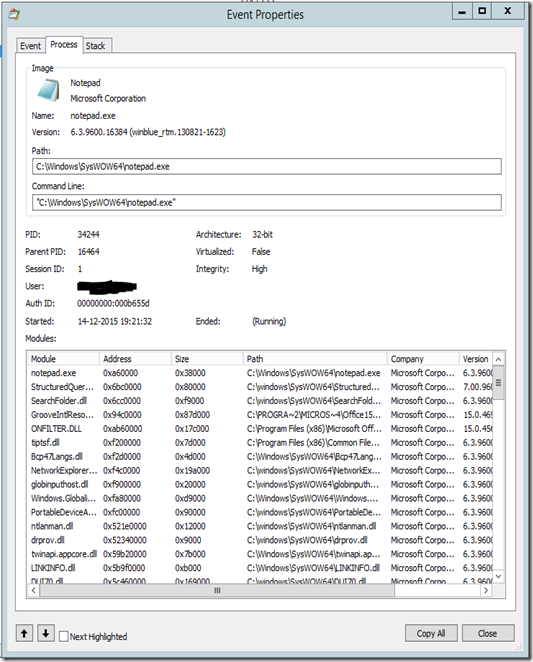
Now you can double click on any one of the above by matching the time stamp of the app domain recycle in the event log. Here you will see which process is trying to write the file and the account used by the process.
 |
Repeat from step 4 and try the above steps for the path contains “Framework” and see if there are any writes happening.
How to analyse the dumps captured using debug diag?
Sometimes I have seen that just running debug diag analysis will give you information on the app domain unload exception. If not I will discuss some tricks as to how we can debug this using windbg.
WinDBG basic setup instructions:
If you don’t have windbg you can go ahead and install windbg from https://msdn.microsoft.com/en-us/windows/hardware/hh852365.aspx
Select and download Standalone debugging tools for windows specific to your operating systems.
You can setup the symbols for your debugger or windbg by opening windbg and going to File->Symbol File Path and entering the below path
SRV*C:\symcache* https://msdl.microsoft.com/download/symbols |
Prerequisites:
Download the netext.dll from https://netext.codeplex.com/ which will be using for analysis.
Copy the appropriate version dll’s inside your debugger installation folder.
How to analyse the dumps?
Open the dump in debugger.
Load the netext.dll in the debugger by typing in the below command.
.load netext |
Before you can run any commands you need to run indexing for the dumps you have.
!windex |
I have worked on 3 of the scenarios which might cause application domain recycles and below are the commands and the outputs you might get
Scenario 1: configuration change
0:035> !wfrom -type System.Web.FileMonitor where ($enumname(_lastAction) == "Modified") $a("==================\nPath",DirectoryMonitor.Directory+"\\"+_fileNameLong),$a("Change Time:",$tickstodatetime(_utcLastCompletion.dateData)) ================== Path: C:\inetpub\wwwroot\web.config Change Time:: 06-10-2015 20:20:39 1 Object(s) listed 14 Object(s) skipped by filter |
Scenario 2: Bin directory change
0:036> !wruntime Runtime Settings per Application Pool ========================================================================= Address : 000000F585279150 First Request : 07-10-2015 01:25:51 App Pool User : IIS APPPOOL\DefaultAppPool Trust Level : Full App Domnain Id : /LM/W3SVC/1/ROOT/TestUserIdentity452-1-130886547510004207 Debug Enabled : False Active Requests : 0n0 Path : C:\inetpub\wwwroot\TestUserIdentity452\ (local disk) Temp Folder : C:\Windows\Microsoft.NET\Framework64\v4.0.30319\Temporary ASP.NET Files Compiling Folder: C:\Windows\Microsoft.NET\Framework64\v4.0.30319\Temporary ASP.NET Files\testuseridentity452\cd5dfb1f\82daaaa9 Shutdown Reason : BinDirChangeOrDirectoryRename at 07-10-2015 01:26:49 Change Notification for critical directories. bin dir change or directory rename HostingEnvironment initiated shutdown Change Notification for critical directories. bin dir change or directory rename Change Notification for critical directories. bin dir change or directory rename HostingEnvironment caused shutdownn at System.Environment.GetStackTrace(Exception e, Boolean needFileInfo) at System.Environment.get_StackTrace() at System.Web.Hosting.HostingEnvironment.InitiateShutdownInternal() at System.Web.HttpRuntime.ShutdownAppDomain(String stackTrace) at System.Web.HttpRuntime.OnCriticalDirectoryChange(Object sender, FileChangeEvent e) at System.Web.FileChangesMonitor.OnCriticaldirChange(Object sender, FileChangeEvent e) at System.Web.DirectoryMonitor.FireNotifications() at System.Web.Util.WorkItem.CallCallbackWithAssert(WorkItemCallback callback) at System.Threading.ExecutionContext.RunInternal(ExecutionContext executionContext, ContextCallback callback, Object state, Boolean preserveSyncCtx) at System.Threading.ExecutionContext.Run(ExecutionContext executionContext, ContextCallback callback, Object state, Boolean preserveSyncCtx) at System.Threading.QueueUserWorkItemCallback.System.Threading.IThreadPoolWorkItem.ExecuteWorkItem() at System.Threading.ThreadPoolWorkQueue.Dispatch() |
Scenario 3: Page change
0:033> !wfrom -type System.Web.FileMonitor where ($enumname(_lastAction) == "Modified") $a("==================\nPath",DirectoryMonitor.Directory+"\\"+_fileNameLong),$a("Change Time:",$tickstodatetime(_utcLastCompletion.dateData)) ================== Path: C:\inetpub\wwwroot\TestUserIdentity452\Default.aspx Change Time:: 09-10-2015 00:11:40 ================== Path: C:\inetpub\wwwroot\TestUserIdentity452\Default.aspx Change Time:: 09-10-2015 00:11:17 ================== Path: C:\inetpub\wwwroot\TestUserIdentity452\Default.aspx Change Time:: 09-10-2015 00:11:34 3 Object(s) listed 15 Object(s) skipped by filter |
Reference: https://netext.codeplex.com/#wfrom
Hope this helps J

