Visio Services refreshing from SQL store procedures
The data linking wizard in Visio 2010 Professional and Premium allows you to connect a SQL table or view to your Visio diagram
but the wizard does not give you the option to specify a stored procedure or a custom query. In this article I will show you a few simple tricks to easily connect your diagram to data from a stored procedure.
Why do you want to connect your diagram to a stored procedure?
Complex queries. Don’t forget that Visio can connect to multiple data sources, hence you can call a stored procedure multiple times, each with different parameters. Also, Visio does not let you connect directly to SQL Server Analysis Services but a stored procedure can.
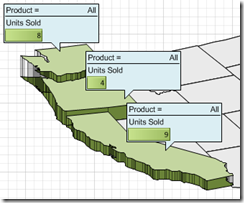
Take for example a multiple page diagram where each page displays a filtered set of data, such as the number of units sold for a specific product type. One page shows us the number of units sold for ALL products and another page shows us the number of units sold for only BUSINESS products.
( US state shapes used in this sample were provided by VisGuy.com, click here. )
This scenario requires two different data sets but each one calls the same stored procedure, supplying a parameter to specify the product type.
Configuring Visio to execute stored procedures
Excel will allow you to configure an Office Data Connection file which specifies the stored procedure to execute along with the parameters to pass. Unfortunately you cannot use an ODC file that specifies a stored procedure with the data linking wizard in Visio. If you save this ODC file to SharePoint and try to connect your Visio diagram to it you will get this error:
Why is this an issue? Because with an ODC file you can specify the authentication method to use for the data refresh operation. I published an article specifically about connecting Visio using an ODC file from Excel. Click here to review this article.
Without the ODC file you simple need to make sure that you properly configure the unattended account and give those credentials access to your SQL database. Click here to review this article.
Instead of using an ODC file we can connect the diagram directly to SQL and alter the command string to execute a stored procedure.
Run the data linking wizard and connect to your SQL database using the Link Data to Shapes button on the Data tab in the ribbon.
Select any table in the list and finish the wizard. A new external data source is now added to the diagram, shown in the External Data window.
Open VBA editor ( ALT + F11 ) and in the Immediate window set the CommandString property of the DataRecordSet to call the stored procedure, including any parameters that needed to be passed.

ex.
ThisDocument.DataRecordsets(1).CommandString = "exec dbo.getSalesForVGSbyType @productType = 'all'"Go back to your diagram, right-click on any record in the External Data window and select the Configure Refresh… menu item.
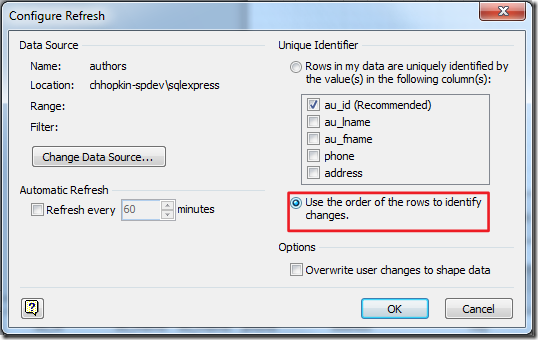
When you connected to the table from your SQL database the primary key was set for you automatically as shown here.
This is not going to work with the new table we get back from the stored procedure the next time we execute refresh, so change this to the ‘Use the order of the rows to identify changes’ option and click OK.
Once again, right-click on a record in the External Data window and click on the Refresh Data… menu item.
You should now see the columns and rows of data returned by the stored procedure.
Now that you have updated the schema from the results of your stored procedure I suggest you go back to the Configure Refresh dialog ( from step 4 above ) and change the Unique Identifier to an appropriate column and click OK.
In this example I know that the State column will be unique.
At this point data refresh is configured and you can now drag and drop the records to the appropriate shapes in your diagram. Don’t forget to configure meaningful data graphics to help you visualize your linked data.
In this example I linked the record for Washington sales to more than one shape, both the state shape as well as a callout shape. The state is using a Color by Value data graphic to color the shape based on the product type. I also wanted to show a data bar and a text label but the state is too small to overlay these items on so I chose to add a callout to the state shape as I can size it to fit the data bar and text callouts as well as move it to any location on the diagram.
When your diagram is ready save it to a SharePoint document library using the Save and Send option on the File tab in the ribbon. Don’t forget to choose the Web Drawing (.VDW) file format or your diagram will not render in the browser.
Download Sample Diagram
Download my Product Map diagram to see how I used the same stored procedure to create multiple data sources ( each refreshed from the same stored procedure using different parameters for each ), one for each page of my diagram to show different graphical views of the data.
Comments
- Anonymous
September 10, 2012
Chris, this is great info - and brings me tantalizingly close to achieving my goal: I'm curious if you know of a way to fetch parameter values from a sharepoint list or other GUI webpart in order to render data-filtered diagrams on a Visio Services web-drawing? I'm striving for true, robust interactivity (say, let user define a time-period to filter the dataset in question and correspondingly apply filter to the shape data)... Most appreciated if you could possibly share your thoughts, know-how, and whether this level of functionality is feasible!Thanks,John - Anonymous
April 30, 2013
Very helpful. Does this still apply to Visio 2013 or is this enhanced in 2013?


