Data connected timelines including a roll up view
It is no secret that Visio provides a template and a set of shape that allow you to easily create very rich and functional timeline diagrams.
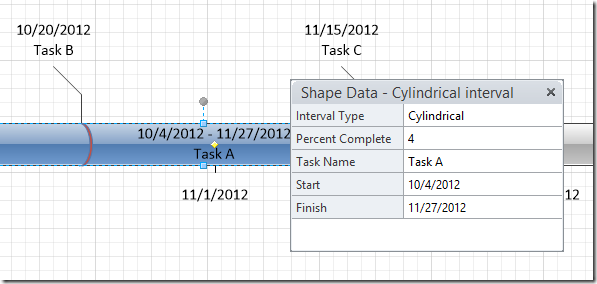
The shapes are actually designed to be data driven, meaning that the shapes provide data properties or Shape Data fields which not only store data that is entered by the user, but also affect the behavior of the shape. In the case of the timeline shapes, data properties like the Start date or Finish date actually change the size and location of the shape in relation to the timeline. Other data properties like Task Name simply display information on the shapes themselves.
If you are not familiar with the timeline solution that is provided with Visio, check out this article which walks you through the primary functionality of this solution.
What the article above does not tell you is how to use the Data Linking features in Visio to connect these timeline shapes to data from an external data source. If you combined the data linking features with the timeline solution shapes you can actually drive the shapes in the diagram automatically as the data in your data source changes. This means that as dates change in the data source, Visio will refresh the diagram from the linked data and the timeline shapes will move and change based on the new dates.
If you are not familiar with the data linking feature and its capabilities check out this short video that will help you get started.
After you data link your timeline shapes, another trick you can use to enhance your diagrams is the ability to create different views of your project task data. The data that you connect to you diagram can be linked to multiple shapes, allowing you to create many different views using the same data source. This allows you to create multiple timeline shapes with different scales. A typical example involves showing a separate timeline for each project and a single overall timeline showing how all the tasks are related or overlap as shown in the screen shot below.
For your enjoyment I have attached a sample diagram with multiple pages as well as a sample Excel workbook that you can use to review this functionality.
Data Connected Timeline with a roll up view.zip
Comments
- Anonymous
January 08, 2013
This is OK - but how to update the timeline itself? In your example it is fixed to the year 2012... - Anonymous
June 25, 2013
The comment has been removed - Anonymous
March 19, 2014
The link that you have shared shows how to link shapes to excel and then goes on to explain how to add graphic objects. But I can not find out how to link data to a specific attribute of the shape itself. Like in your example, you have linked the task start date with excel. If you change it in excel and do a refresh in visio, the task start date changes. How did you achieve this? - Anonymous
March 19, 2014
Ok! Got the answer to my question. The column headings have to match with the shape property names :)

