A Guide to the Internet Explorer 8 Developer Tools
 This is a follow up post for a talk I recently gave at the The Ajax Experience conference in Boston about using the developer tools included with Internet Explorer 8.
Want to see the tools in action? I have a screencast on Internet Explorer 8 from a dev perspective on Channel 9. I also cover new features and compatibility, but skip to 24:30 for just the developer tools:
Getting Started with the Developer Tools
Simple enough! In IE8, hit F12 or choose Tools-> Developer Tools to start.
 You can either run the tools in browser or press the double window icon at top right to detach for a second monitor or to use side by side with the browser.
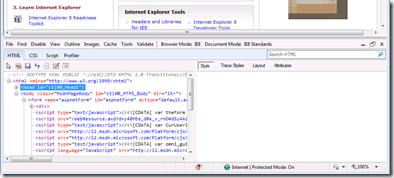
The tools offer a full menu and four tabbed sections of features: HTML, CSS, Script, and Profiler.
Working with HTML and CSS
The first tab (HTML) gives access to inspecting the structure of the page, selecting and searching elements and HTML, modifying values, saving locally-made changes, and more. Tip: click the button that looks like a mouse pointer to quickly select a page element (or press CTRL+B).
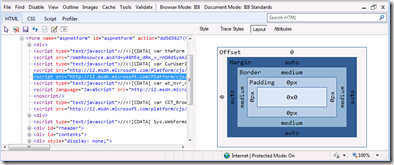
The right-hand pane shows a per-element CSS summary (Style) and hierarchy/trace (Trace Styles), offers a visual layout tool, and a way to set custom attributes. Tip: Trace Styles is particularly effective way to diagnose style inheritance issues (e.g. “why is that text red!?”).
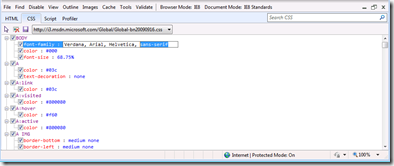
The second tab (CSS), displays current CSS classes and styles, allowing you to view specific CSS files in use by the page, make changes, and search.
For details, see Debugging HTML and CSS with the Developer Tools on MSDN.
Debugging Script
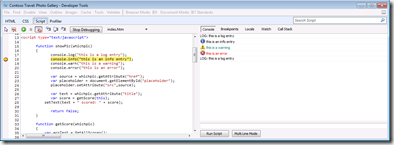
The Script tab lets you work with script, setting breakpoints, debugging through code and breaking on errors.
To debug, just set any breakpoints you need (you can choose other files using the drop-down list) then press “Start Debugging”. You can also enable Break on Error mode (CTRL + Shift + E). Once at a breakpoint, step into/through with the buttons or F10, F11, and Shift+F11.
There’s a console in the right-hand pane which supports Console.Log/Warn/Info/Error output from your script. The console also supports direct script execution. Tip: this is a great place to learn/test commands from various Ajax and Javascript libraries.
The pane also lets you view breakpoints, local and watch variables, and the call stack.
See Debugging Script with the Developer Tools for more.
Profiling Script
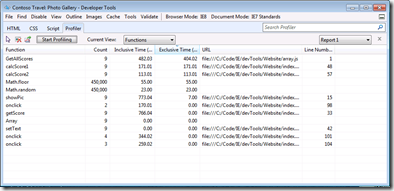
One of the most useful features is the ability to analyze code to measure it’s performance. Just select the fourth tab (Profiler) and click “Start Profiling”. Use the part(s) of the application you’d like to analyze, then click “Stop Profiling”.
You’ll see a summary report showing functions, how many times they were called (Count), timing. Inclusive time is the function plus any called functions, and exclusive time is that function only. Tip: there are other columns as well (% time, min/max time, etc.), but by default they’re collapsed, so click between column headers to expand them.
Use the Current View drop-down to switch between a list of functions or a call tree view.
You can also click the “Export Data” button to save the profiling report externally (e.g. to load into Excel).
See Profiling Script with the Developer Tools for more.
Menu Options
On the right side of the menu, you’ll see options to change the Browser Mode and Document Mode. This lets you modify the browser behavior and page settings to test under different rendering and display conditions. See this MSDN article for more.
Don’t forget to look through the many options in the various menus. For example:
 Image and Link reports
- Element outlining (tables, divs, etc.)
- Cache management
- Pop-up blocker, script, and CSS disabling
 Tools to resize the browser, measure items, and select colors
- Options to send a page for validation
- Clear/view cookies
Questions
Some details for questions asked during and after the session:
- The Search bar supports the W3C Selectors API, but you need to type an “@” symbol before your expression, otherwise it’s treated as a literal text search.
- The script profiler works on a usage basis, profiling all code executed between using the “start profiling” and “stop profiling” commands. I have not seen a way to affect which scripts code is profiled during that time (like you can with using the Profiler APIs to affect Team System’s instrumentation profiling).
Internet Explorer Resources
Finally, a summary of resources to get you underway:
 IE 8 Home
- IE 8 Developer Center
- My screencast on IE8 for developers
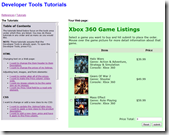
- IE 8 Dev Tools Tutorial sample site
- IE 8 Dev Tools Articles
- For keyboard fans, the Keyboard Shortcuts guide
I hope you enjoy using the developer tools!
-Chris

