Troubleshoot environments deployed through self-service deployment
Important
Functionality noted in this article will be made available to users based on the geographic location recognized by Microsoft Azure.
This article explains how you can troubleshoot issues on an environment that was deployed using the self-service deployment experience. When a user reports an issue, you can use various tools in Lifecycle Services (LCS) for troubleshooting. The rich set of telemetry data helps you build a storyboard view that shows what that user and other users were doing when the issue was reported.
To open the Environment Monitoring dashboard, follow the steps listed below:
- Open LCS and navigate to the appropriate project.
- In the Environments section, select the environment that you want to view, and then click Full details.
- On the Environment details page, click Environment monitoring to open the Monitoring and diagnostics portal.
On the Environment Monitoring dashboard, you will see two tabs: Overview and Activity.
Overview tab
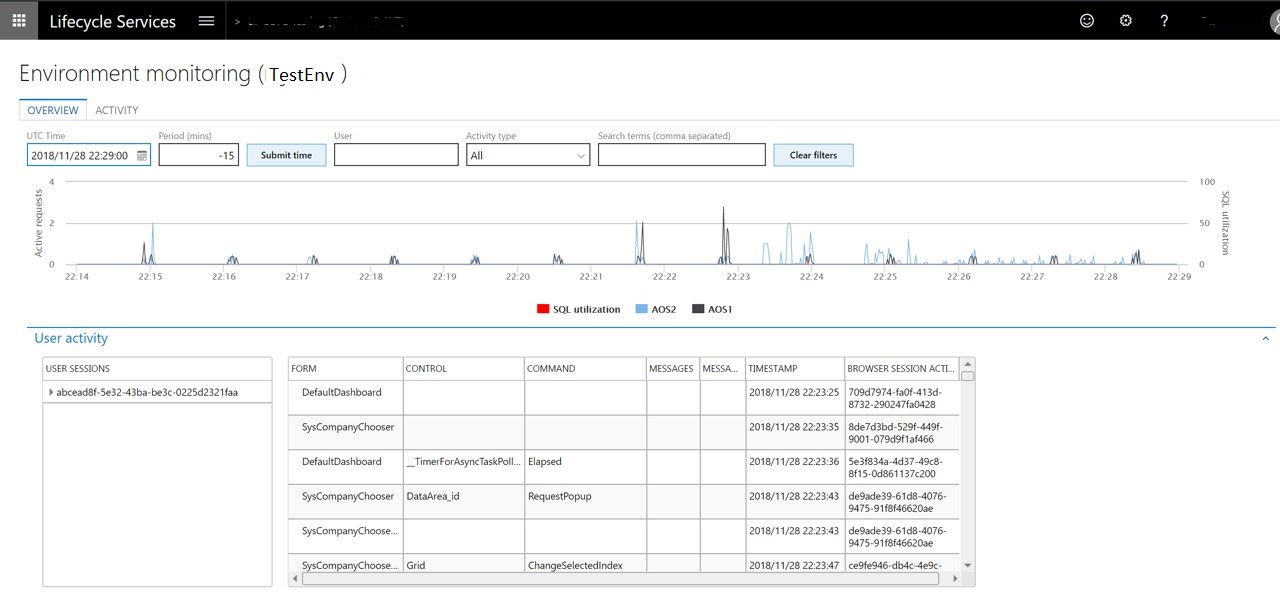
The Overview tab provides a storyboard view that shows how the environment was being used during a specific period. You can use the filters on this page to narrow the information logs. Here are some of the filters that are available:
- Time duration: Go back 60 minutes from the selected date and time.
- User: View a specific user's activities.
- Search terms: Create a search that is based on the issue that is being investigated.
In addition, you will also see two sections:
- The User interaction chart shows a user's activities on various machines in the environment and the SQL utilization trend.
- The User activity grid shows the various activities that users performed, based on their session timestamp. The active sessions display on the left side of the grid. For each session, the Form:Control:Command and the corresponding timestamp show when the action was taken. You can trace the exact steps that the user was taking in the information presented in this grid.
Important
The Overview tab will also include the CPU and memory health metrics to help with diagnostics. This feature is currently not available but will be added soon.
Activity tab
The Activity tab shows a predefined set of queries for advanced troubleshooting. This gives you access to the raw information logs. You can then export the logs to do more advanced analysis. The following types of queries are available:
- User-related errors
- Slow queries
- Deadlocks
- Crashes
Note
The data shown on the Overview and Activity tabs is only retained for 30 days.
Important
The Environment monitoring will also include advanced SQL troubleshooting tools to diagnose and mitigate performance issues. This feature is currently not available but will be added soon.
