Finding the process ID
Each process running in Windows is assigned a unique decimal number called the process ID (PID). This number is used in a number of ways, for example to specify the process when attaching a debugger to it.
This topic describes how you can determine the PID for a given app using Task Manager, the tasklist Windows command, the TList utility, the PowerShell Get-Process command, or the debugger.
Task Manager
Task Manager can be opened in a number of ways, but the simplest is to select Ctrl+Alt+Delete, and then select Task Manager.
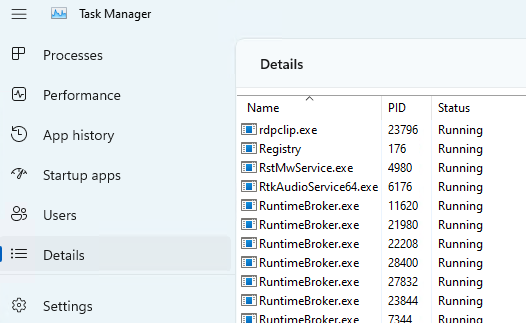
In Windows, first click More details to expand the information displayed. From the Processes tab, select Details to see the process ID listed in the PID column.

Click on any column name to sort. You can right click a process name to see more options for a process.
Some kernel errors may cause delays in Task Manager's graphical interface.
The tasklist command
Use the built in Windows tasklist command from a command prompt to display all processes, their PIDs, and a variety of other details.
C:\>tasklist

Image Name                     PID Session Name        Session#    Mem Usage
========================= ======== ================ =========== ============
System Idle Process              0 Services                   0          8 K
System                           4 Services                   0      7,428 K
Secure System                  104 Services                   0     40,344 K
Registry                       164 Services                   0    146,596 K
smss.exe                       592 Services                   0      1,176 K
csrss.exe                      896 Services                   0      6,224 K
wininit.exe                    980 Services                   0      6,572 K
...
Use tasklist /? to display command line help.
TList utility
Task List Viewer (TList), or tlist.exe, is a command-line utility that displays the list of tasks, or user-mode processes, currently running on the local computer. TList is included in the Debugging Tools for Windows. For information on how to download and install the debugging tools, see Debugging Tools for Windows.
If you installed the Windows Driver Kit in the default directory on a 64 bit PC, the debugging tools are located here:
C:\Program Files (x86)\Windows Kits\10\Debuggers\x64\
When you run TList from the command prompt, it will display a list of all the user-mode processes in memory with a unique PID number. For each process, it shows the PID, process name, and, if the process has a window, the title of that window.
C:\Program Files (x86)\Windows Kits\10\Debuggers\x64>tlist -t
System Process (0)
System (4)
  smss.exe (592)
  Memory Compression (3376)
Secure System (104)
Registry (164)
csrss.exe (896)
wininit.exe (980)
  services.exe (660)
    svchost.exe (1232)
      WmiPrvSE.exe (6008)
      dllhost.exe (1748)
      WmiPrvSE.exe (1860)
...
For more information, see TList.
The .tlist debugger command
If there's already a user-mode debugger running on the system in question, the .tlist (List Process IDs) command will display a list of all PIDs on that system.
PowerShell Get-Process command
To work with automation scripts, use the Get-Process PowerShell command. Specify a specific process name, to see the process ID for that process.
C:\> Get-Process explorer

Handles  NPM(K)    PM(K)      WS(K)     CPU(s)     Id  SI ProcessName
-------  ------    -----      -----     ------     --  -- -----------
   2520     404   108948     179284   1,702.95   7656   1 explorer
For more information, see Get-Process.
Additional resources
To learn more about Windows internals (including context, threads, and processes), review additional resources, such as Windows Internals by Pavel Yosifovich, Mark Russinovich, David Solomon, and Alex Ionescu.