 Visual Studio 2022 version 17.11 release notes
Features
Version 17.11 Released August 13th, 2024
This release focuses on **quality-of-life** enhancements for all developers and workloads. When you use Visual Studio, you want to feel empowered and productive. That's why quality-of-life features are so important: they make coding a smooth and enjoyable experience, free of unnecessary hassles and headaches. We hope you'll love this update.
| IDE | From the community |
|---|---|
| Never miss installing a component | Feedback ticket |
| Stay updated and secure | Feedback ticket |
| New Teams Toolkit templates | |
| Improved user authentication |
| Web | From the community |
|---|---|
| Discover dynamic Web API routes | Feedback ticket |
| NPM packages in Solution Explorer |
| Gaming | From the community |
|---|---|
| Unreal Engine Add Class Templates | Feedback ticket |
| Unreal Engine Add Module | Feedback ticket |
| Unreal Engine Add Plugin | |
| Unreal Engine Toolbar |
| .NET | From the community |
|---|---|
| Revamped Resource Explorer | Feedback ticket |
| C++ | From the community |
|---|---|
| Build Insights QoL Update | |
| Debug your CMake projects on Linux | Feedback ticket |
| Custom Clang-Tidy Executable |
| Top bug fixes | From the community |
|---|---|
| TS1109 (TS) Expression expected error in Razor file | Feedback ticket |
| Rich copy/paste of C# source code into Office fails | Feedback ticket |
| Incorrect error with in-class pointer to member variable | Feedback ticket |
| MSVC v19.37+ incorrect code gen for arithmetic expressions | Feedback ticket |
| C4506 (no definition for inline function) incorrectly reported for template spec... | Feedback ticket |
| Missing integral types overload for cmath functions | Feedback ticket |
| GitHub Copilot has a 'References' button that is mistranslated | Feedback ticket |
| After updating to VS 17.10 the size of .ilk files has increased considerably | Feedback ticket |
| Visual Studio jump list doesn't add recently opened solutions any more | Feedback ticket |
Note
See the full list of all the user-reported feature requests and bug fixes that made it into this release.
Productivity
Find the code you're looking for
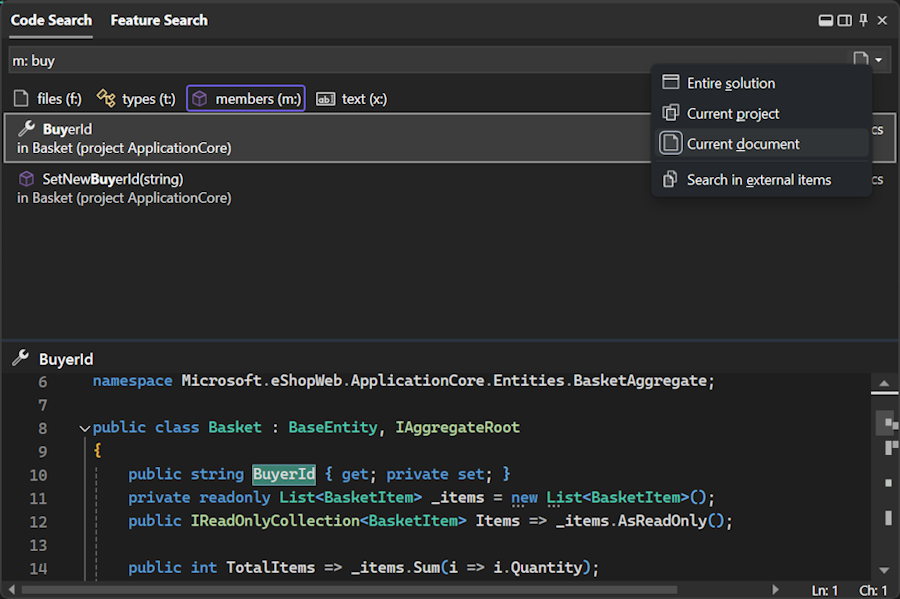
Narrow down a code search from the entire solution to the current document or current project.
Do you ever feel like you're seeing too many results in code search? Narrow down your focus with the newly added scoping options in Code Search.
For the default code search experience and each filter, you can now set the scope to Entire solution, Current project, or Current document and toggle inclusion of external files.
You can set different scopes for different filters. For example, the default experience can be set to look through Entire solution and members can be set to look through only current document. Your selections will be preserved past the current session.
Note
This feature must be enabled under Tools -> Manage Preview Features
📣 See feature ticket to share your feedback and continue the conversation.
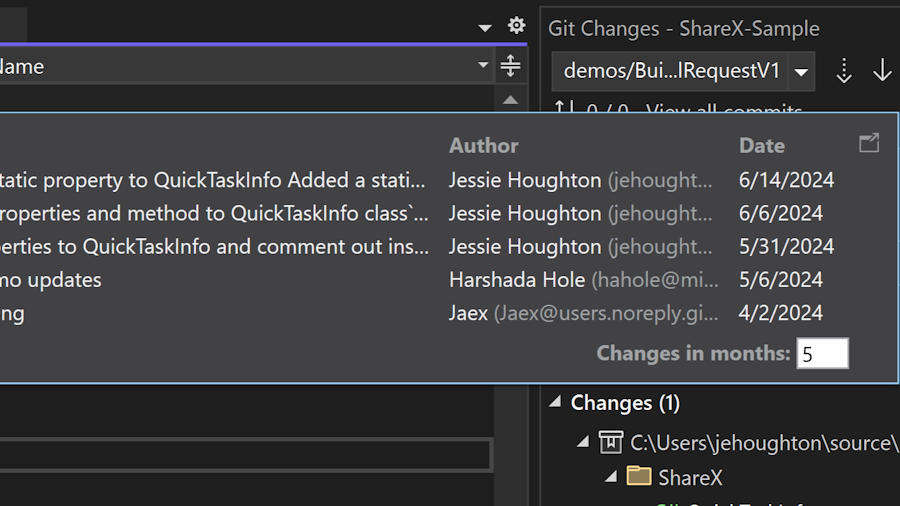
Fix for CodeLens timeline
Fix to respect configuration of your CodeLens timeline to show the correct information.
CodeLens timeline now respects the configuration of your timeline to show the correct information. This fix addresses an issue where the timeline was not honoring the months set in the file changes hover preview.
📣 See feature ticket to share your feedback and continue the conversation.
Updates to pull request creation
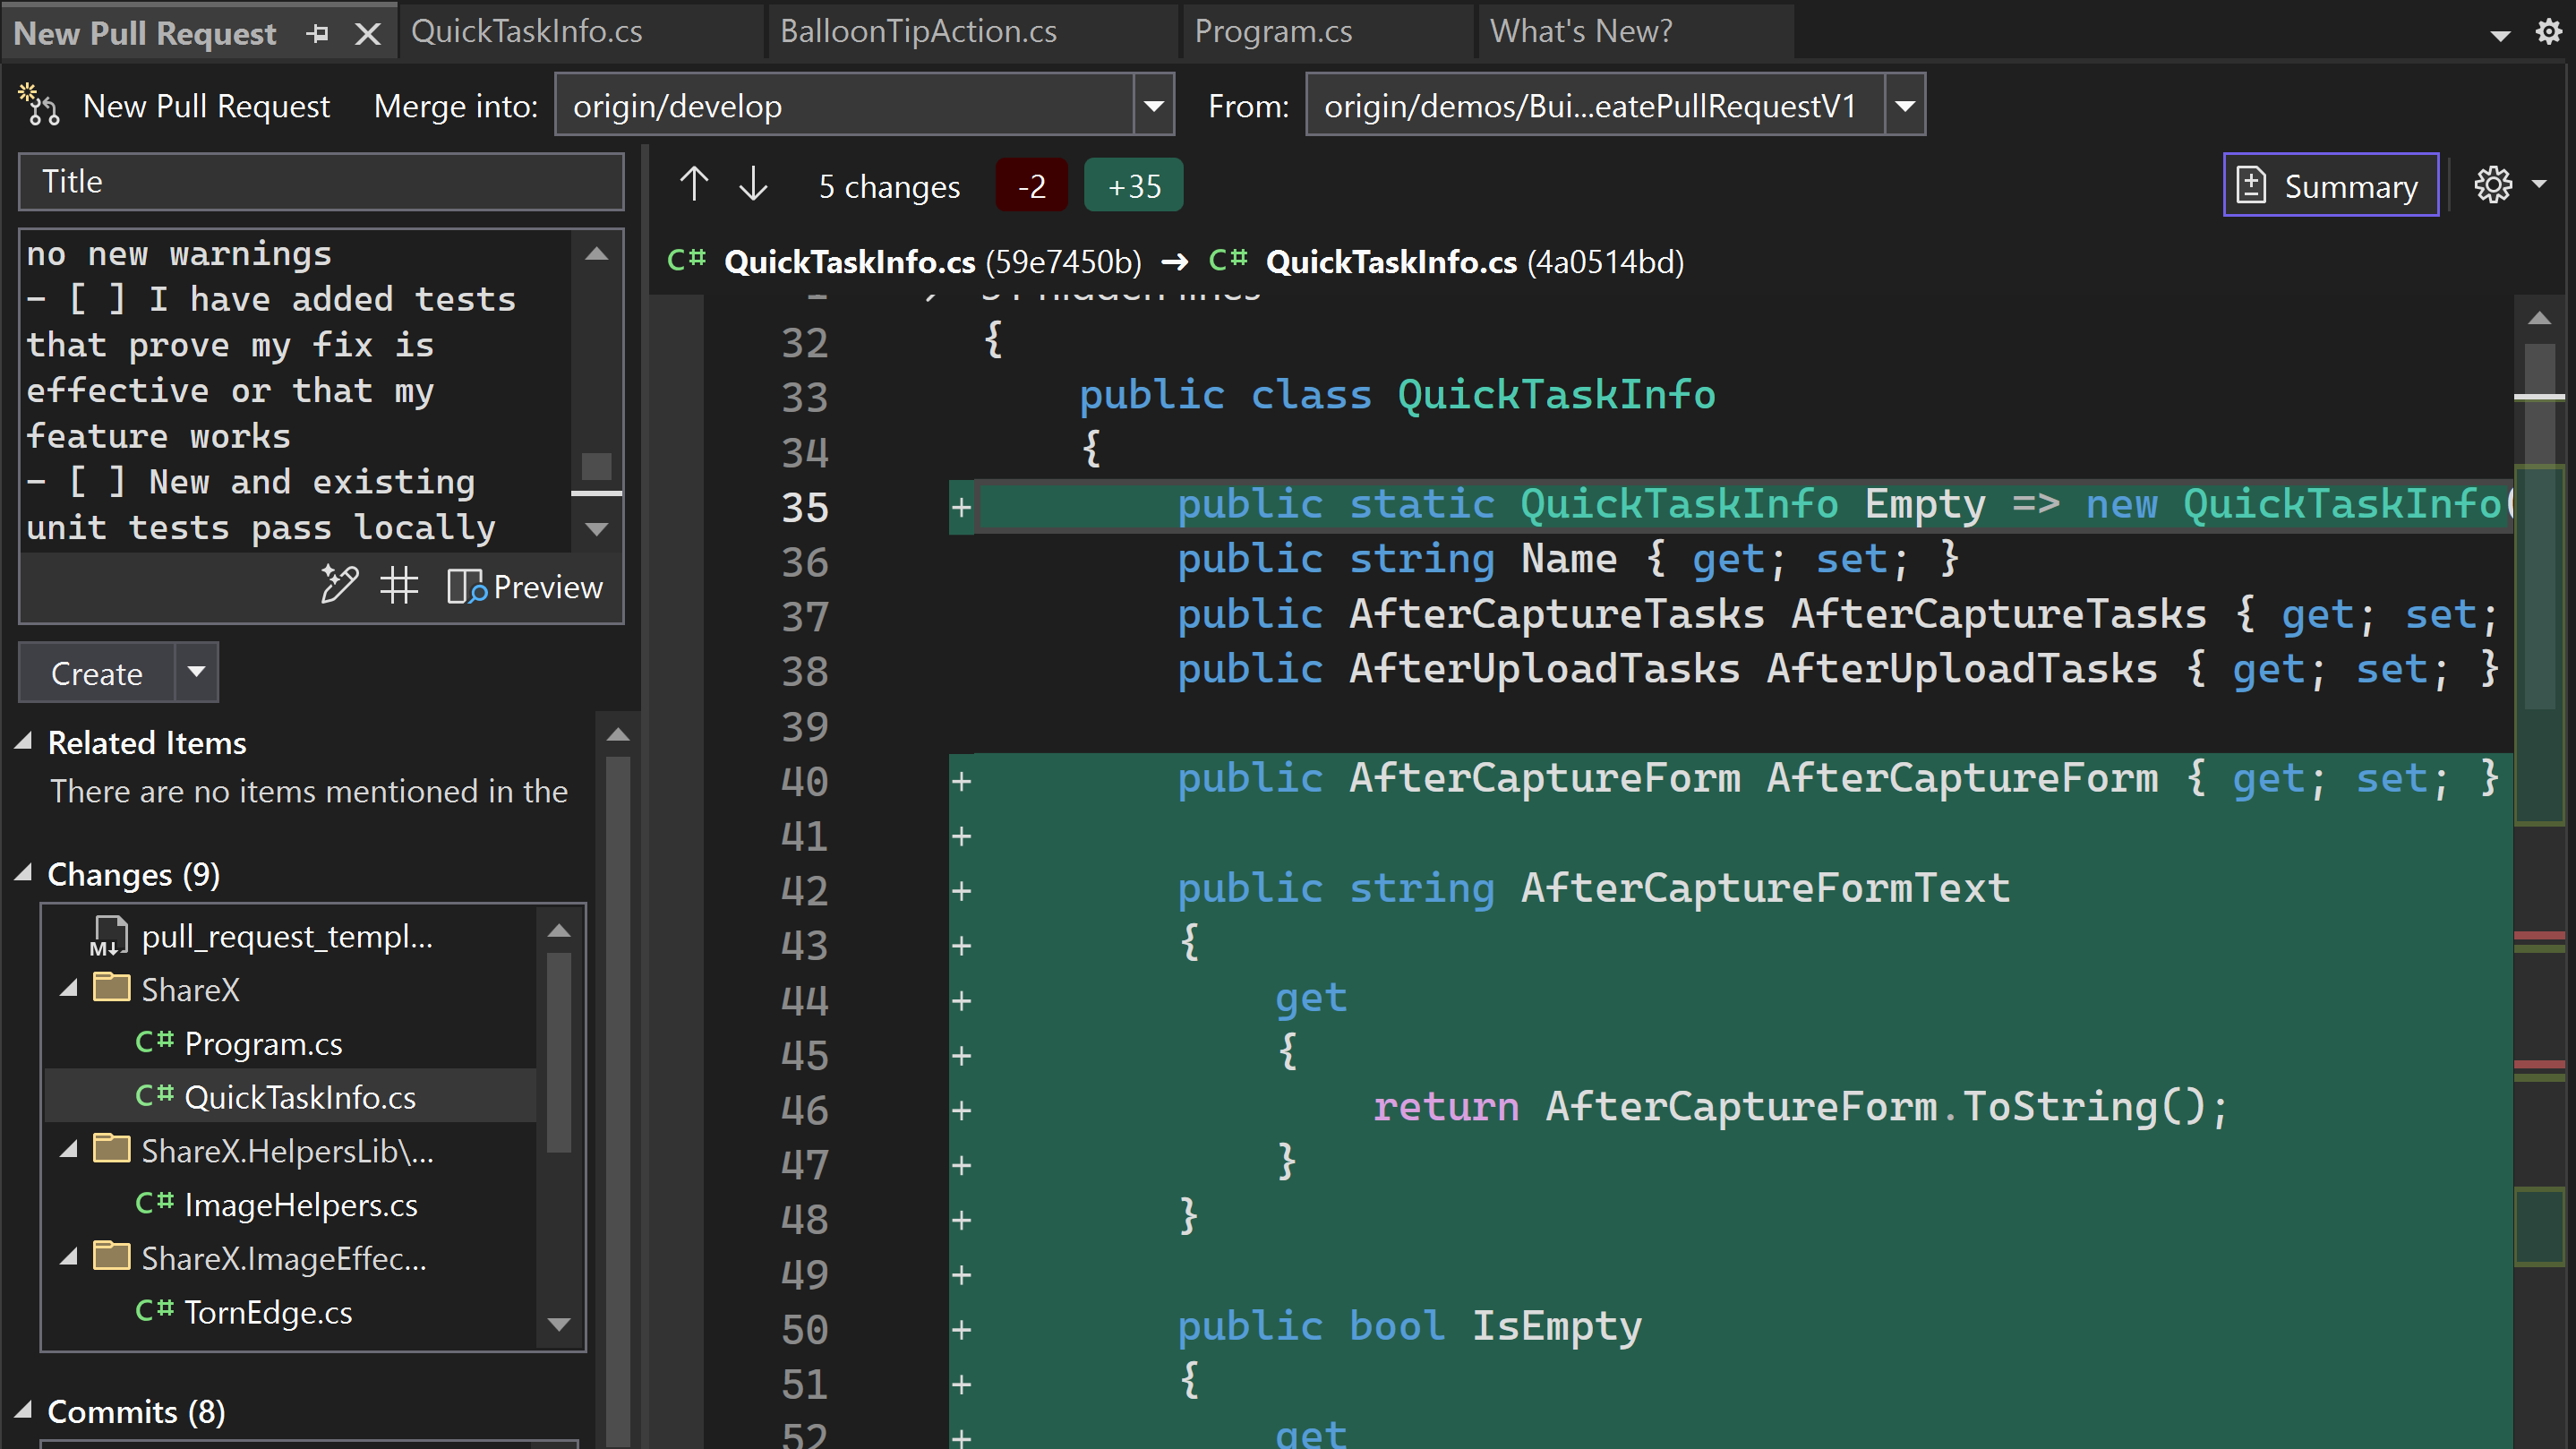
Continual improvements to the pull request creation experience.
We've improved on the create a pull request experience with target branch selection, commit counts, and other stabilization fixes. Additionally, we now automatically create links to work items that have been mentioned in commits that are part of the pull request.
More meaningful code reviews
View your Azure DevOps and GitHub pull request comments directly in your working file.
We've made it easier to view your GitHub and Azure DevOps pull request comments directly in your working file in Visual Studio. You can now stay in your context, make necessary code changes, and interact with your colleagues' suggestions without switching contexts to the browser.
New Improvements
Enable the feature flag, Pull Request Comments, checkout any branch with an active pull request branch, and click on Show comments in files in the InfoBar.
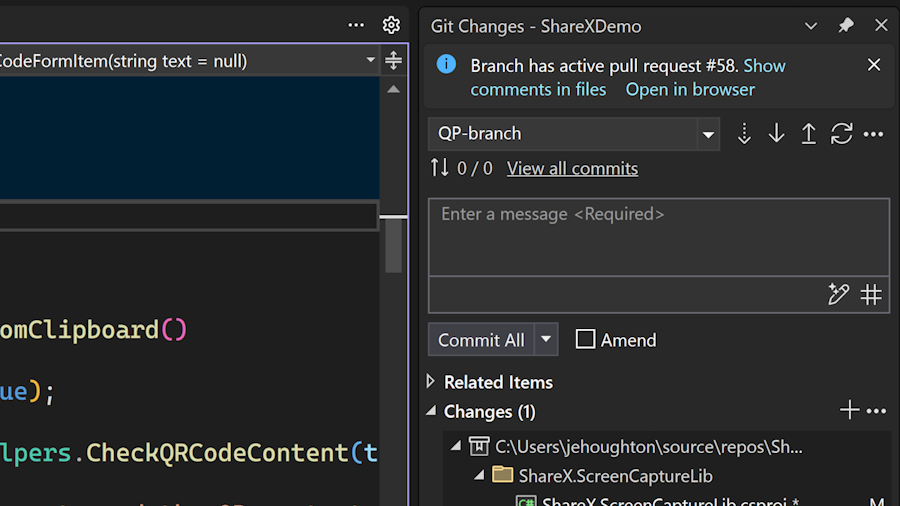
The latest improvements include better support for @ mentions and work item references, visual improvements to the attention dot and comment margin, the addition of avatars, better sync with the server, and an additional entry point in the Git changes window.
Note
This feature must be enabled under Tools -> Manage Preview Features
📣 See feature ticket to share your feedback and continue the conversation. And take this survey to help make the feature even better.
Familiar keyboard shortcuts
Some common keyboard shortcuts now match those in other popular IDEs.
When moving between different IDEs and editors, it can be frustrating to have to relearn keyboard shortcuts. We've made some changes to some default keyboard shortcuts to make them more familiar and to preserve your muscle memory.
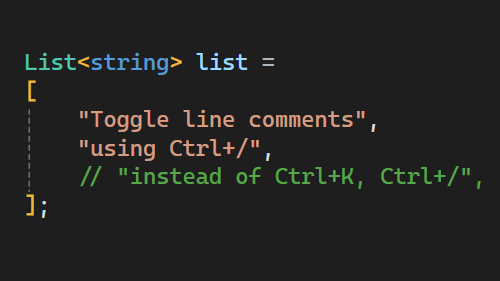
Toggle line comments
You've been able to toggle line comments in Visual Studio for a long time, but the default keyboard shortcut was Ctrl+K, Ctrl+/. We've now added Ctrl+/ as an alternative shortcut, which is the default in many other IDEs and editors.
Note
Please note that for non-English keyboards, the shortcut may be different.
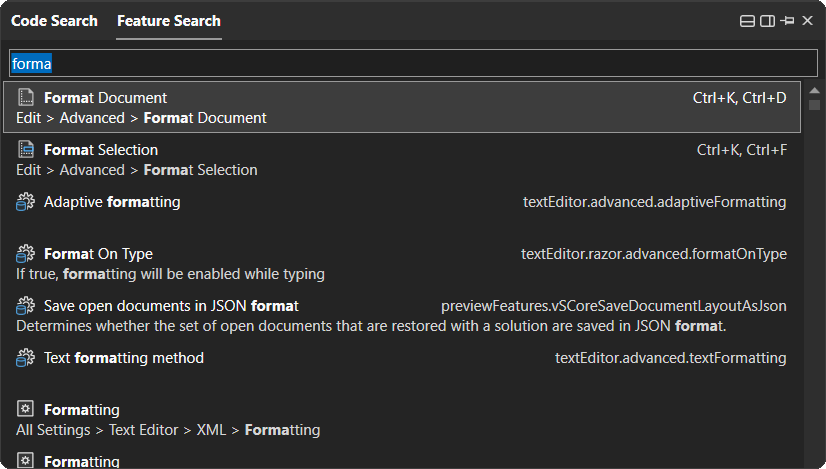
Open Command Palette
Or Feature Search as it's called in Visual Studio. The default keyboard shortcut for this feature is now Ctrl+Shift+P, which should be familiar to VS Code users for opening the Command Palette.
📣 See feature ticket to share your feedback and continue the conversation.
GitHub Copilot
Refer to your methods in GitHub Copilot
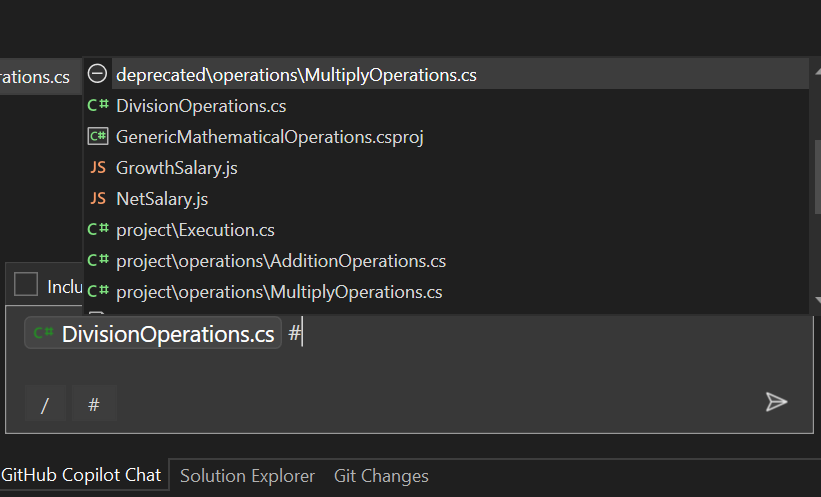
GitHub Copilot Chat now allows you to refer to your methods, classes, and functions inline. This feature helps you to provide more context to GitHub Copilot, which in turn helps it to provide more accurate responses with GitHub Copilot having an even deeper understanding of your solution.
By referring to methods, classes, and functions directly within the chat, you can provide specific context that helps GitHub Copilot better comprehend their code and the problem at hand. This feature empowers you to provide richer context to GitHub Copilot, enabling it to deliver more precise responses by gaining a deeper understanding of your codebase.
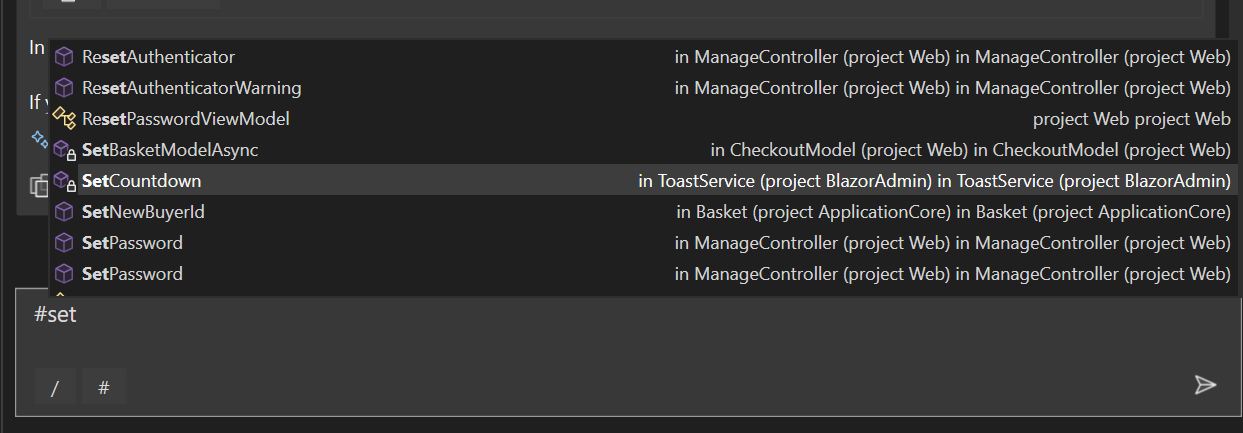
How to refer to your symbols in GitHub Copilot Chat
To refer to your symbols, simply use the # symbol followed by the name of the method, class, or function you want to reference.
Try asking GitHub Copilot Chat
Try asking GitHub Copilot Chat questions like:
- I have a test method named #methodName. How can I ensure that it's being executed correctly?
- Could you help me understand the differences between the #methodName1 and #methodName2 functions?
- Where is the output of the #methodName function used in my code, and what purpose does it serve?
- /explain #methodName
Important
To use this feature, make sure to activate GitHub Copilot
Understand your symbols with GitHub Copilot
GitHub Copilot assists you in understanding symbols at different invocations without your code base.
GitHub Copilot is now integrated into the tooltip on hover over symbols to provide AI-generated summaries of the selected symbol. This is available for both C# and C++ developers. This feature assists developers in understanding descriptions of various symbols at different invocations within their codebase. By hovering over a symbol and selecting the Tell me more option in the hover tooltip, GitHub Copilot can generate documentation for the selected symbol.
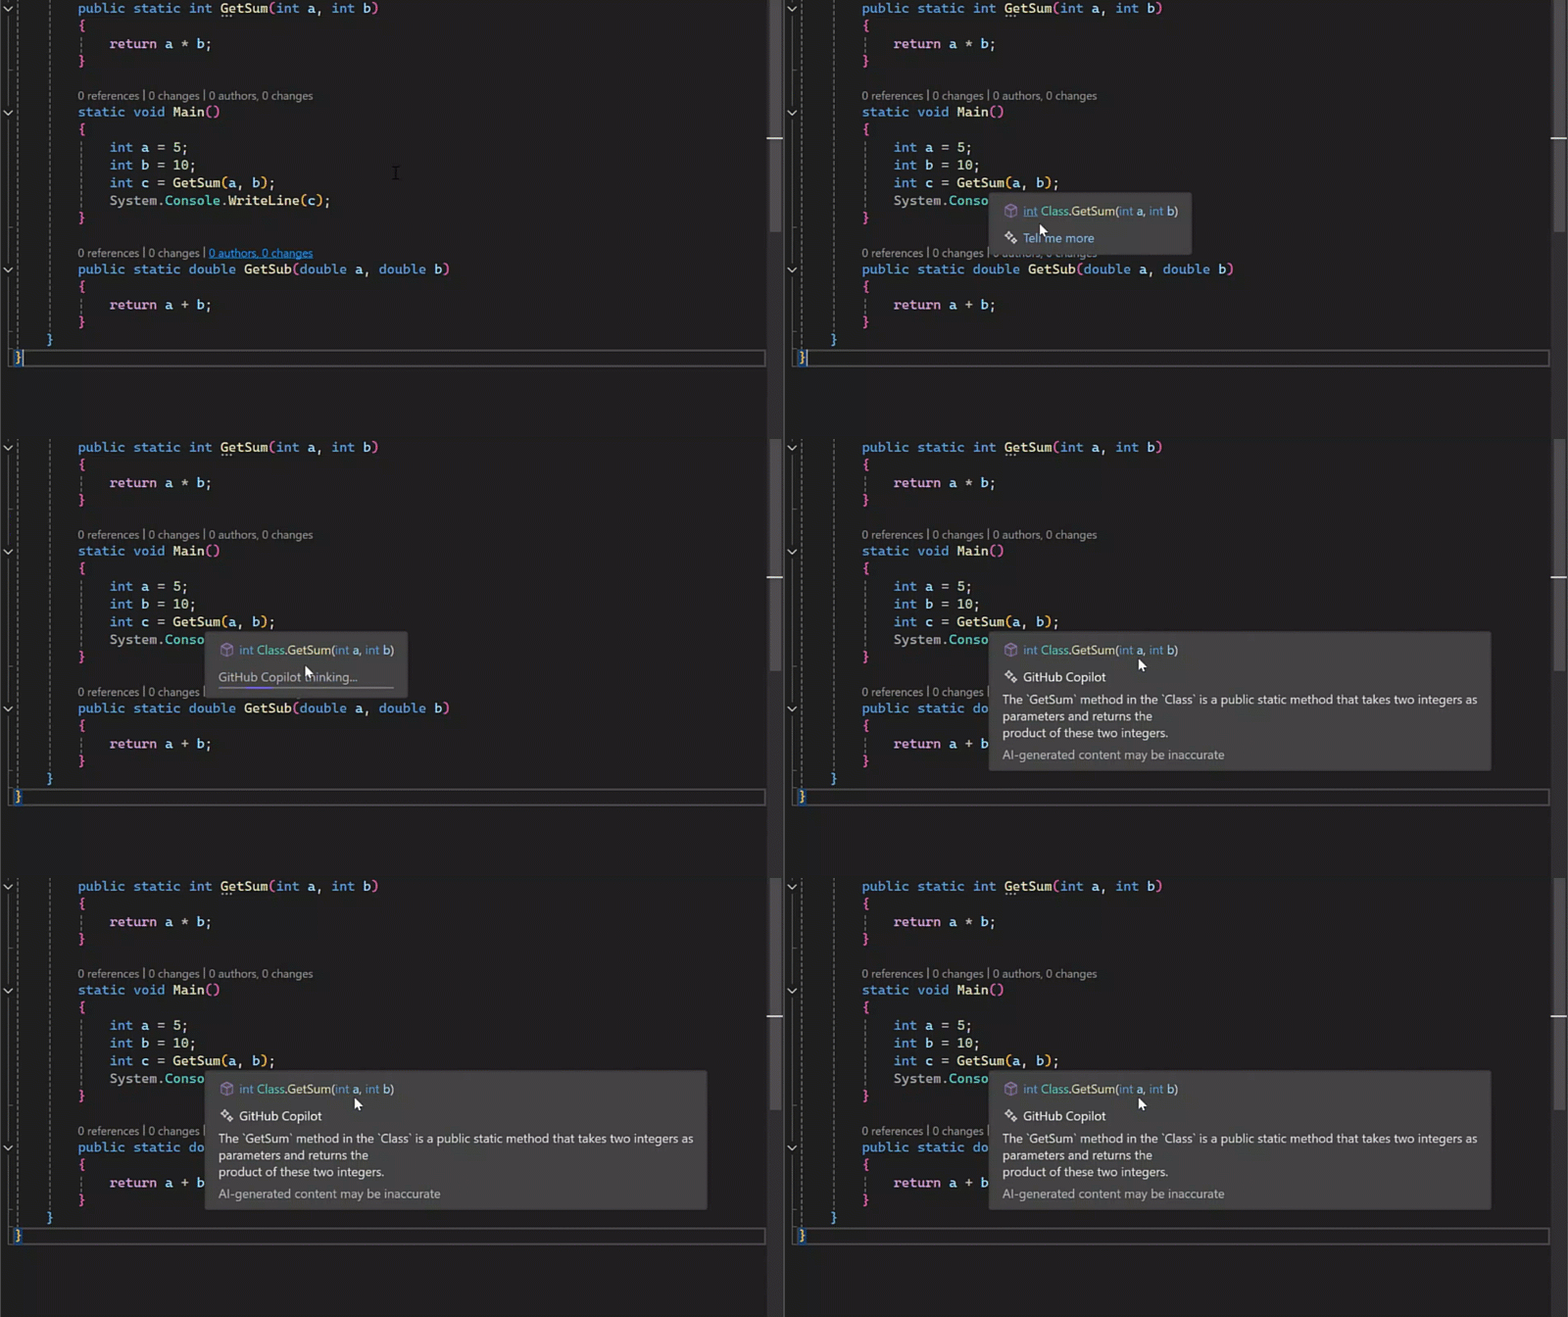
Leveraging LLMs, GitHub Copilot enhances existing or lacking code documentation by providing insightful explanations and context within hover tooltips.
Important
To use this feature, make sure to activate GitHub Copilot
📣 See feature ticket to share your feedback and continue the conversation.
GitHub Copilot is getting smarter
GitHub Copilot now includes context from your entire repository & can search the web.
GitHub Copilot Enterprise subscribers in Visual Studio can now use GitHub Copilot Chat to get answers enriched with context from their entire repository and Bing search results.
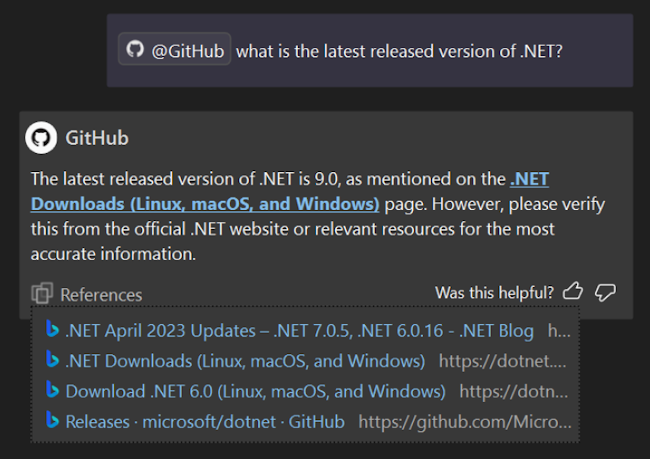
Get answers from across your entire codebase
GitHub Copilot Chat can now answer questions with understanding of your full repository, not just the tabs you have open. Index your repository on GitHub.com, and then ask a question mentioning @github. You can ask questions like @github where is rate limiting implemented?
Search with the context of the web
GitHub Copilot chat can also search Bing to find information outside of its general knowledge or your codebase. When you mention @github, GitHub Copilot will intelligently decide when to use Bing. You can ask questions like @github what is the latest LTS version of Node.js?
Bing search is only available if enabled by an administrator - for more details, see Enabling GitHub Copilot Enterprise features or read the docs.
Important
To use this feature, make sure to activate GitHub Copilot
GitHub Copilot is even more secure
GitHub Copilot Business customers to prevent specified files or repositories from being used to inform code completion suggestions made by GitHub Copilot.
GitHub Copilot Content Exclusion is available for GitHub Copilot Business, and GitHub Copilot Enterprise customers to prevent specified files or repositories from being used to inform code completion suggestions made by GitHub Copilot.
Keep your code secure
GitHub Copilot will now exclude the content of the affected files. This will be available for Completions, Inline, Chat, and all other GitHub Copilot experiences in Visual Studio.
Configure Content Exclusions
For repository administrators and organization owners, content exclusion will be configurable for files, folders, file types, and more. Learn more about Configuring Content Exclusions for GitHub Copilot in the GitHub Copilot documentation.
Important
To use this feature, make sure to activate GitHub Copilot
Refine your GitHub Copilot suggestions
With the integration of GitHub Copilot into Visual Studio, we are enhancing experiences across completions and chat. This enhancement aims to streamline your workflow, making it easier for you to refine completion suggestions and transition conversations across different interfaces.
With the integration of GitHub Copilot into Visual Studio, we are enhancing experiences across Completions and Chat. This enhancement aims to streamline your workflow, making it easier for you to refine Completions suggestions and transition conversations across different interfaces.
Refine for GitHub Copilot Completions with Inline chat
You now have more control over the suggestions provided by GitHub Copilot. Instead of merely accepting or ignoring a suggestion, you can now retry! This feature allows you to modify and curate the proactive suggestions given by GitHub Copilot, by adding context or tweaking the completion.
Start by modifying your Completions:

Refine your prompt with Inline Chat:

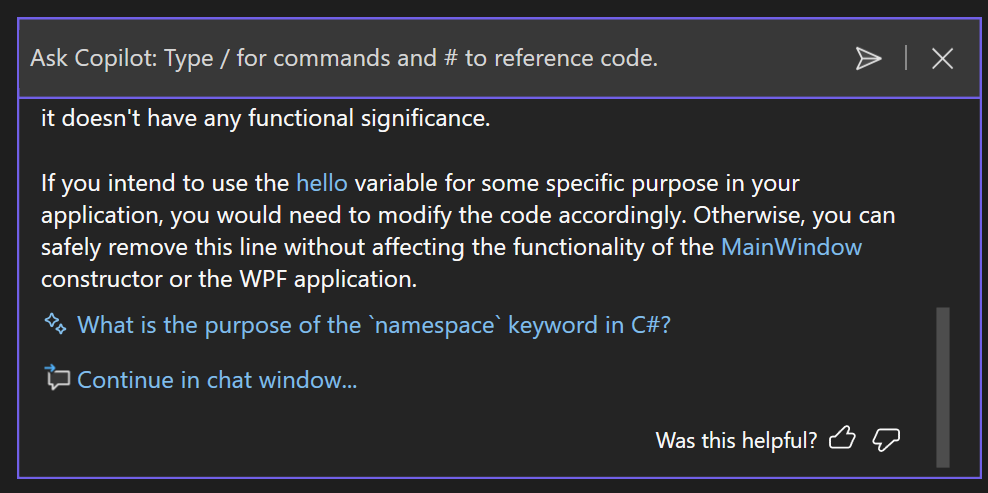
Promote Inline Chat to the Chat Window for more context
Preserve the history of your Inline Chat by promoting it to the Chat Window. This feature enables you to maintain a record of the conversation and continue the Chat Window at your convenience on a larger screen.
Select Continue in chat window...
Important
To use this feature, make sure to activate GitHub Copilot
Naming things made easy
You can use GitHub Copilot to generate naming suggestions for your identifiers in C++.
GitHub Copilot can now generate naming suggestions for your identifiers (variables, methods, or classes) based on how your identifier is being used and the style of your code.
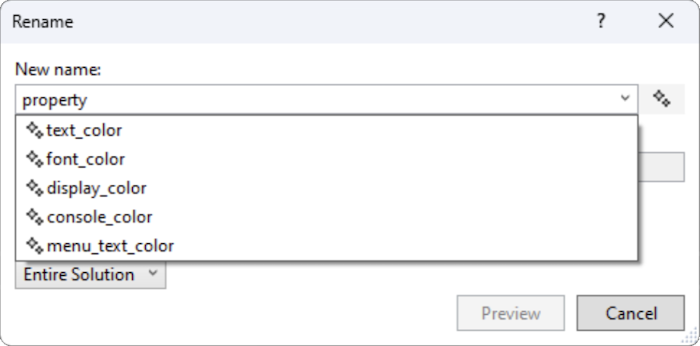
To try it out, you'll need an active GitHub Copilot subscription. Navigate to any variable you wish to rename, right-click -> Rename (Keyboard: Ctrl+R, Ctrl+R). You'll notice a GitHub Copilot sparkle icon that you can click or toggle to generate naming suggestions.
This feature is available for C#, C++, and more languages.
Important
To use this feature, make sure to activate GitHub Copilot
AI smart variable inspecetion
Optimize your debugging workflow with Integrated AI variable inspection.
Inspecting and analyzing values from Locals, Autos, and DataTips has never been easier with Ask GitHub Copilot in Visual Studio. Simply right-click on any value to get detailed AI-driven insights on errors, unexpected outcomes, or anomalies - all without ever leaving your IDE.
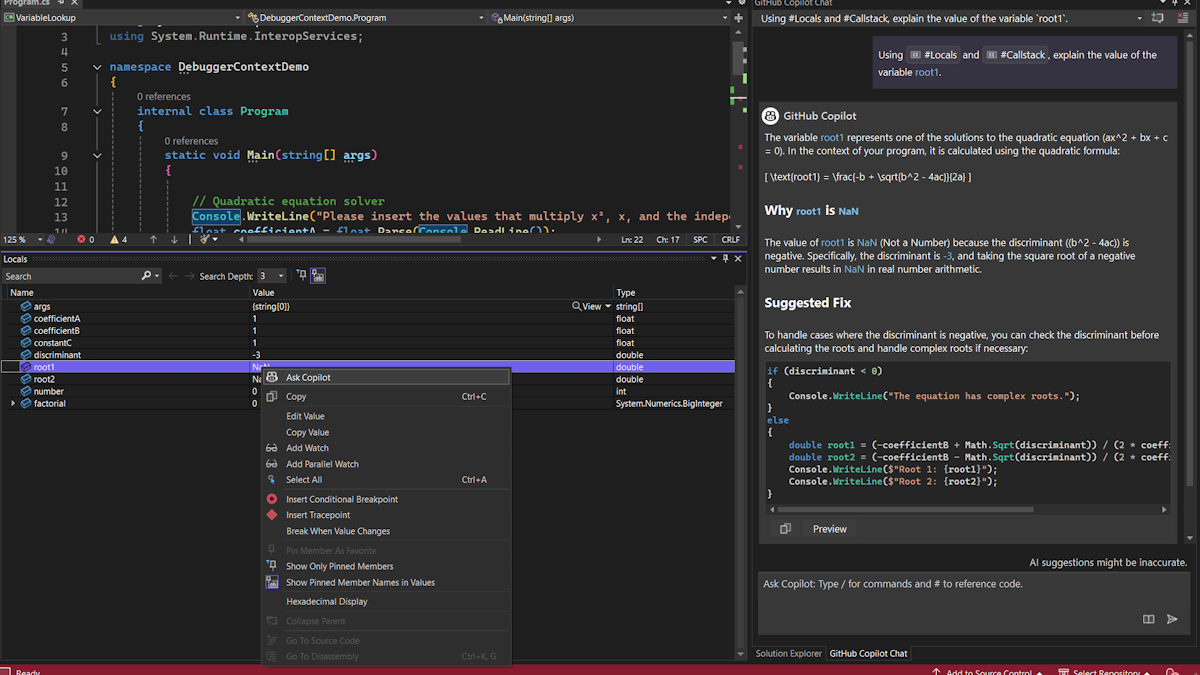
This feature will significantly enhance your troubleshooting speed by analyzing variables in real-time within your IDE whenever unexpected values arise.
Important
To use this feature, make sure to activate GitHub Copilot
AI-generated breakpoint expressions
Use AI-generated expressions to insert conditional breakpoints or tracepoints in C++.
AI-generated expressions for conditional breakpoints and tracepoints are now supported in C++. GitHub Copilot analyzes your code and offers insightful breakpoint expressions, streamlining your debugging process.

When you position the cursor within the condition text for a conditional breakpoint/tracepoint in the breakpoint settings window, GitHub Copilot will promptly offer AI-generated expression suggestions based on your codebase. You have the flexibility to select the condition that best fits your requirements for placing the conditional breakpoint/tracepoint.
Important
To use this feature, make sure to activate GitHub Copilot
Debugging & diagnostics
Easier to fix async exceptions
The debugger now breaks on async method exceptions caught by framework code.
Debugging asynchronous code, especially in frameworks like ASP.NET, can be tricky due to the potential for exceptions to be thrown across asynchronous boundaries.
Now, with Visual Studio Debugger it automatically breaks when an async Task method throws an exception back to framework code.
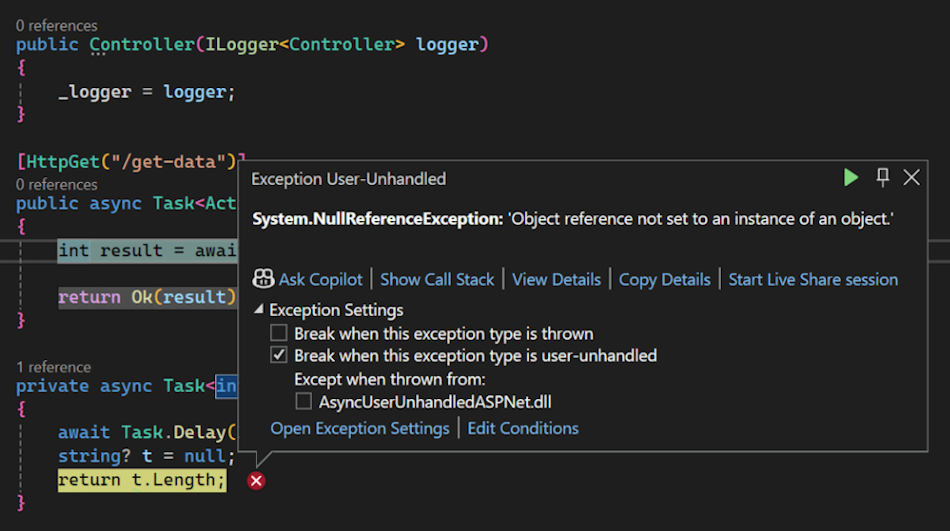
This will allow you to easily identify and diagnose issues in your ASP.NET applications, leading to faster debugging cycles and improved productivity.
Please note that this is for .NET 9 and newer projects only.
📣 See feature ticket to share your feedback and continue the conversation.
Profile faster and more consistently
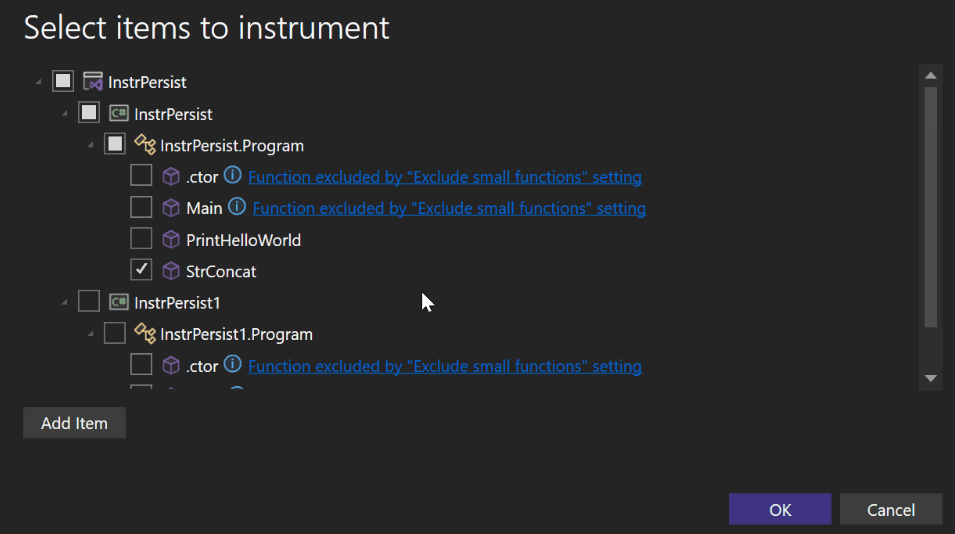
The instrumentation tool in the profiler now remembers your target selection between runs.
The instrumentation tool now persists the target selection between runs offering a significant benefit by enhancing the continuity of profiling sessions.
With this improvement, you can maintain your specified target across multiple instrumentation runs, eliminating the need for repetitive selection tasks.
Profile external code with ease
The profiler supports auto-decompilation for .NET libraries, enabling effortless profiling of external code.
Visual Studio profiler now offers auto-decompilation for .NET libraries in scenarios where source code is unavailable. By automatically decompiling code during source lookup, even without loaded symbols or exact file locations, you can gain insights into the code's structure and performance issues.
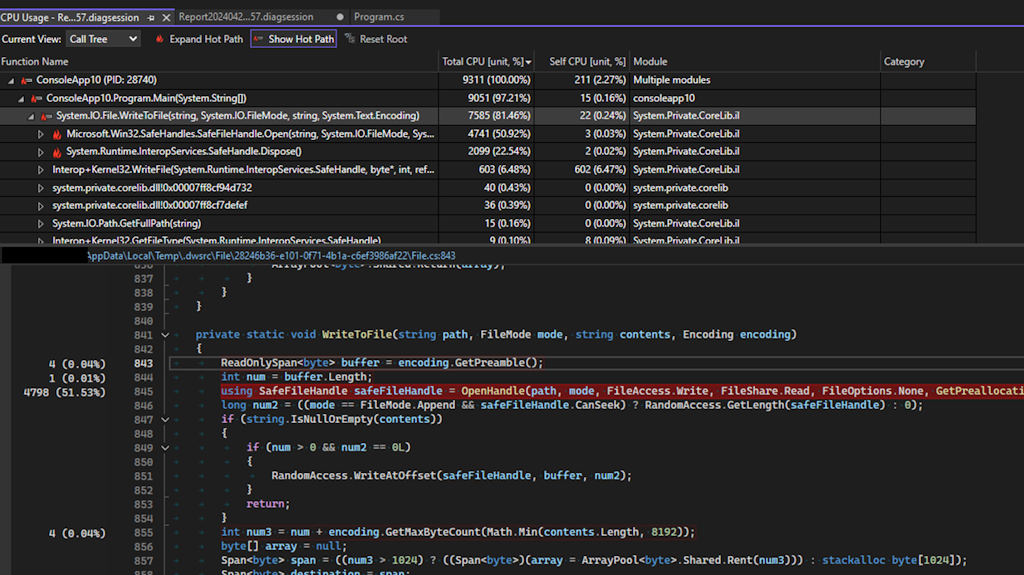
This feature is particularly advantageous when dealing with non-user external code, empowering you to analyze and optimize your application's performance effectively, thus enhancing your development workflow.
📣 See feature ticket to share your feedback and continue the conversation.
Improved debugging on Arm64
The Visual Studio debugger supports AnyCPU applications manifested to run as arm64.
Visual Studio natively supports building and debugging Arm64 apps on Arm-based processors. Unfortunately, applications built with the AnyCPU setting running on an Arm64 machine, will default to using x64 emulation. While the capabilities of the x64 emulator have expanded, the most efficient Arm CPU scenarios are supported when applications are running natively.
To better support the intended native behavior the Windows 24H2 update introduces a new <supportedArchitectures> setting for your App manifest files. .NET developers can include a list of supported architectures (amd64 or arm64), explicitly signaling that an application built with the AnyCPU setting should run natively using the Arm64 CLR on Arm64 devices.
With this release Visual Studio can read these new manifest entries when the application launches, allowing debugging to be initiated based on the correct architecture.
Blazor WebAssembly debugging
A preview of the improved debugging experience for Blazor WebAssembly apps targeting .NET 9 or later.
Visual Studio now offers a preview of an improved debugging experience for Blazor WebAssembly apps targeting .NET 9 or later:
- Data types shown in the debugger now match the expected .NET data types.
- Type members and member visibility use expected icons.
- The displayed call stack is cleaned up to only shows the .NET call stack and correctly honors the Just My Code setting.
- The modules window is now supported.
- Expression evaluation support in the Immediate window and for watches and conditional breakpoints is expanded and improved.
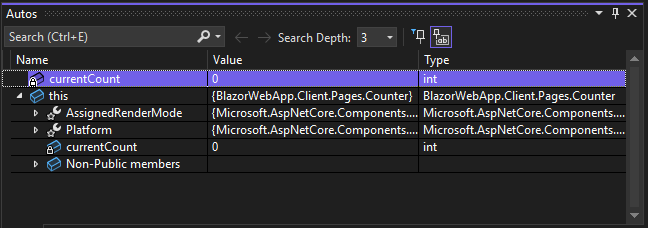
To enable the new preview debugging experience:
- Enable the Enable New .NET 9+ Mono Debugger setting.
- Install the latest .NET 9 SDK.
- Update your Blazor app to target .NET 9.
Known limitations:
- Hot reload while debugging is not yet fully functional. This will be addressed in a future update.
Auto-add breakpoints to the default group
Organize breakpoints for swift troubleshooting with default breakpoint groups in Visual Studio.
You can now mark the selected breakpoint group as the default, ensuring all newly added breakpoints are automatically included in that group.
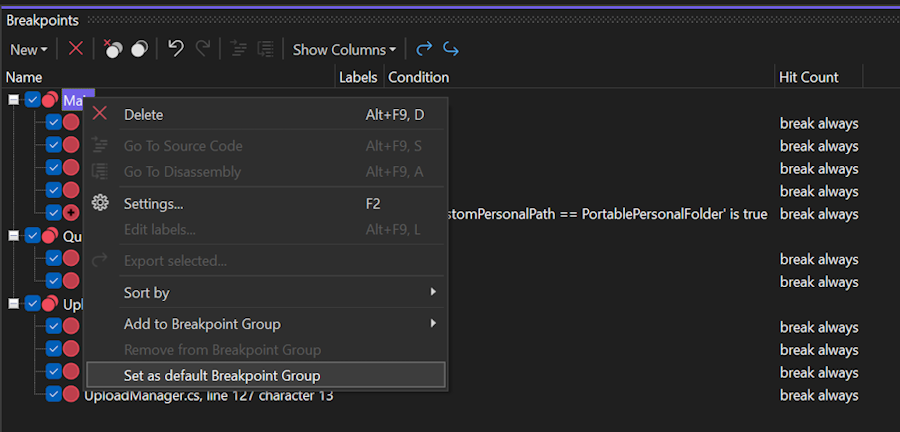
This enhancement simplifies the management and organization of breakpoints, providing seamless debugging when investigating multiple issues.
📣 See feature ticket to share your feedback and continue the conversation.
Expressive IEnumerable Visualizer
The editable expression feature in the IEnumerable visualizer allows direct editing and visualization of LINQ expression in the Visual Studio debugger.
The Visual Studio debugger now offers an editable expression feature in the IEnumerable visualizer, a powerful enhancement for developers working with collections.
Overview
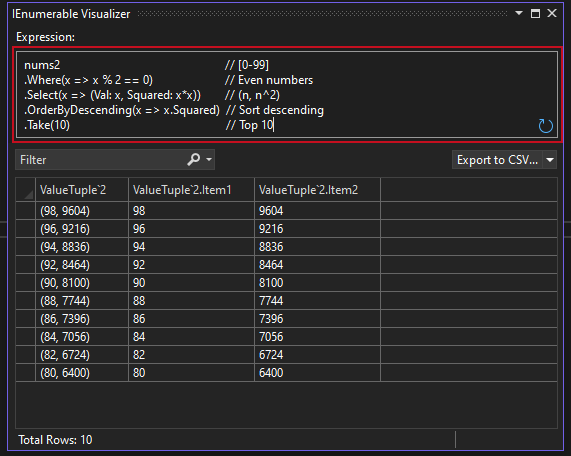
With this new feature, while visualizing a collection or dataset, you can directly modify the expressions textbox on the top of the dialog with your desired LINQ expressions. The visualizer updates in real-time, reflecting the data change resulting from your query.
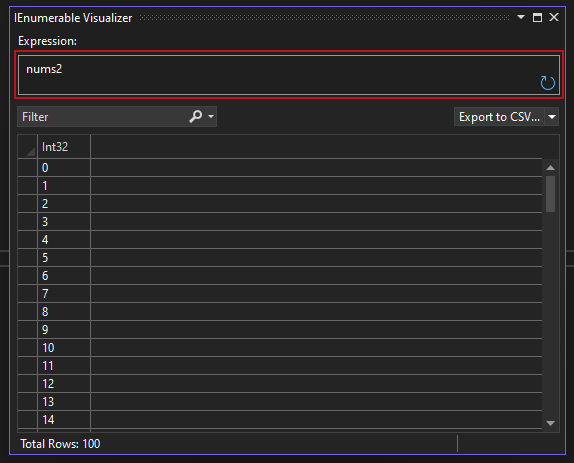
Potential Applications
The editable expression feature facilitates debugging of dense datasets and complex collection manipulations. You can easily apply different filters or sort orders to your collections based on your needs. By experimenting with data transformations and filters directly within the Visual Studio debugger, you can streamline your development workflow and achieve more efficient debugging. Here is an example to try out on your own:
Faster C++ breakpoints
Optimize your debugging with enhanced conditional breakpoints performance in C++.
We have significantly enhanced the performance of conditional breakpoints in C++ through a reworked implementation.
Our initial assessment indicates a performance improvement of at least 35% in version 17.10 and 70% in version 17.11 P2, reducing execution time from 80 seconds to 21 seconds over 80,000 iterations.
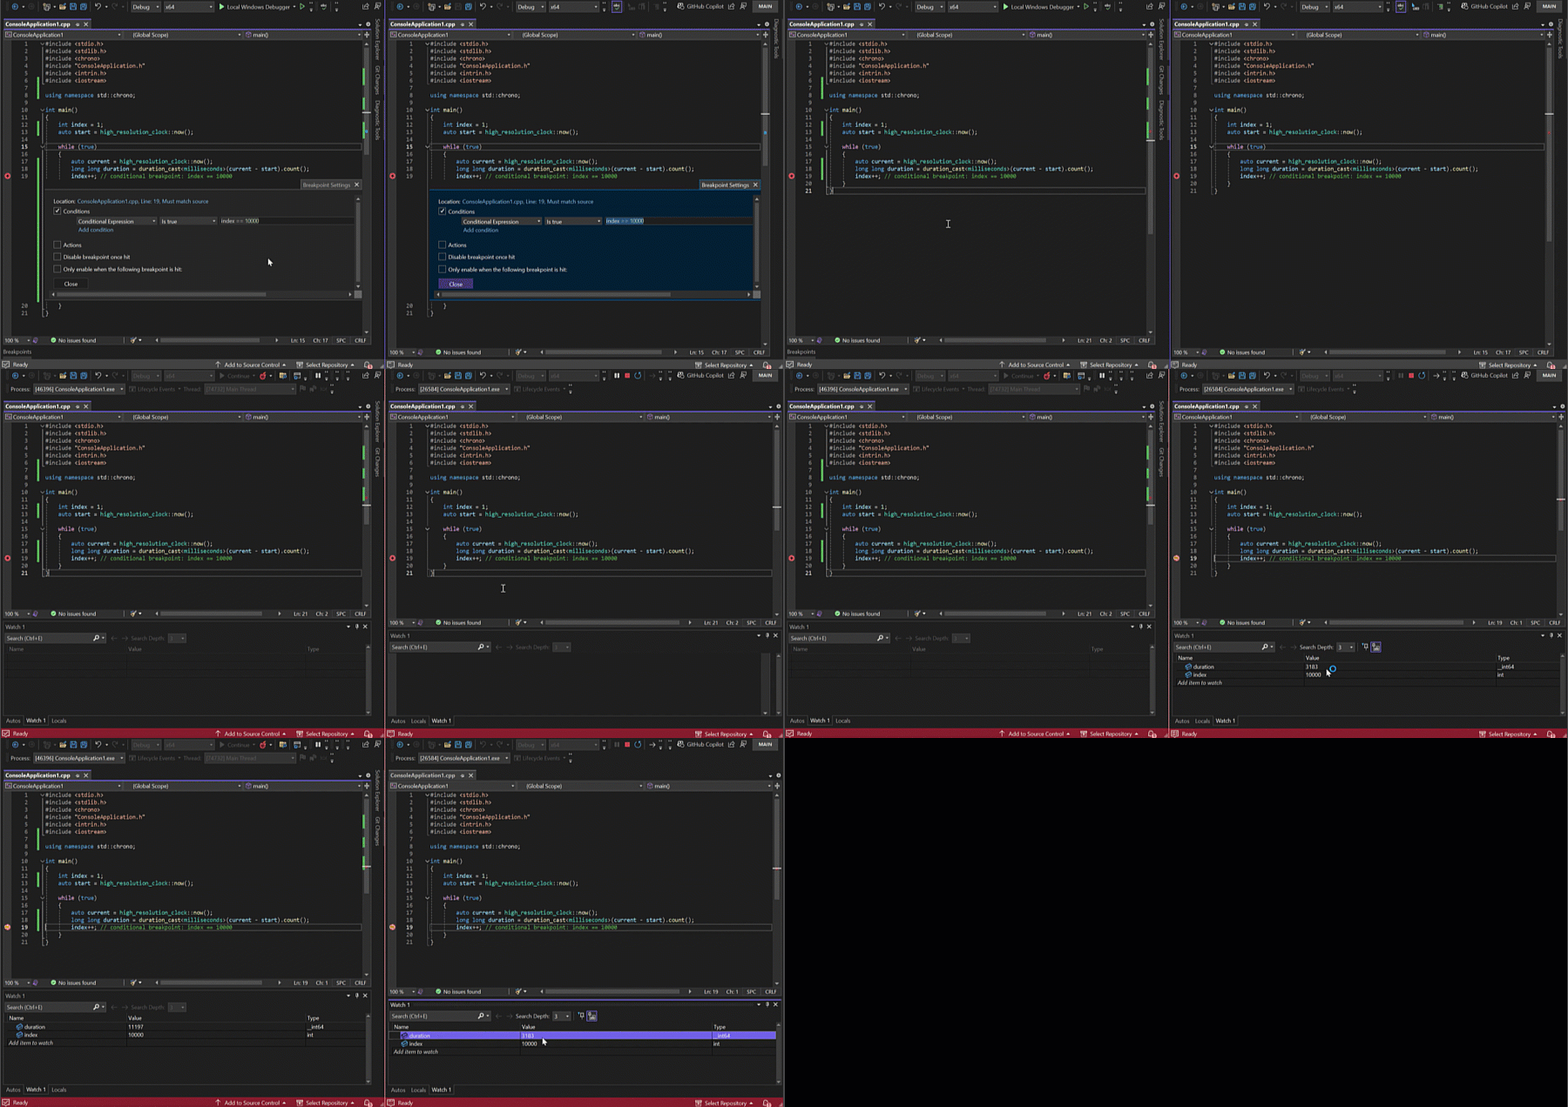
As shown in the video, the left side shows the conditional breakpoints performance in version 17.9, while the right side shows the performance in version 17.10 onwards.
IDE
Never miss installing a component
By using *.vsconfig files, you can ensure that your team has all the necessary components and extensions installed that your solution requires.
Many teams use *.vsconfig files to standardize their teams' Visual Studio installations. The *.vsconfig files can be placed in a repo or a project's solution directory, and Visual Studio will automatically detect if components specified in the *.vsconfig file are missing.

If any are missing, then a notification such as the one pictured below will appear.
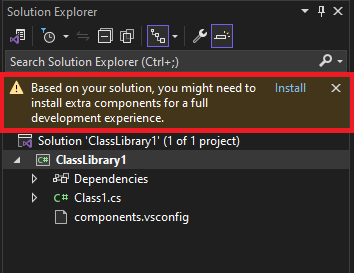
We've made two improvements to this experience in Visual Studio 2022 version 17.11 Preview 1.
- First, Visual Studio can now detect if any local or network hosted extensions are missing from the installation, and if so, it'll prompt you to install them. Previously, with respect to extensions, Visual Studio was only able to recognize if marketplace extensions were missing.
- Secondly, Visual Studio will now re-prompt the notification in certain situations, such as if the *.vsconfig file has changed because new components or extensions get added to it. Previously, the notification would only pop until you acted upon it, at which point it would be suppressed forever.
📣 See feature ticket to share your feedback and continue the conversation.
Stay updated and secure
Keep Visual Studio updated and secure by enrolling in Microsoft Updates.
Keeping your software updated on a regular cadence is a security best practice that we highly recommend.
Starting in August 2024, Visual Studio security updates will be available to Community SKU users through the Microsoft Update channel, which is part of the Windows Update system. Community SKU users that enroll in this update channel will automatically receive and install Visual Studio monthly security updates silently and in the background when the machine is idle, which makes it super easy to stay updated and secure. Further information can be found in this blog post.
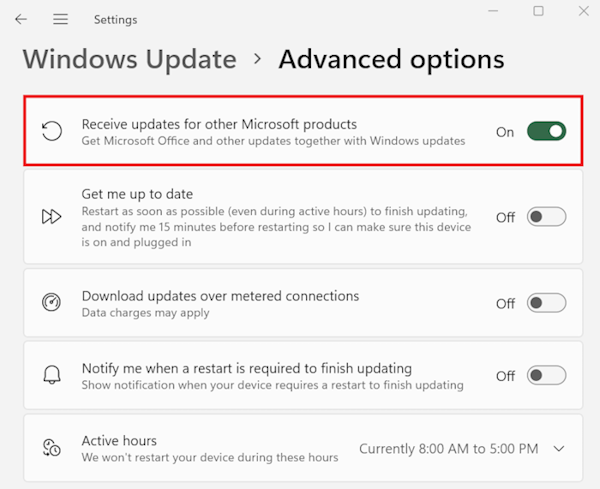
This functionality is an extension of our Administrator updates solution, which was designed to help organizations stay secure. Many enterprises, including Microsoft, have been using this solution to automatically deploy hundreds of thousands of security updates each month.
📣 See feature ticket to share your feedback and continue the conversation.
New Teams Toolkit templates
Teams Toolkit added new Teams app templates for a better Teams development experience.
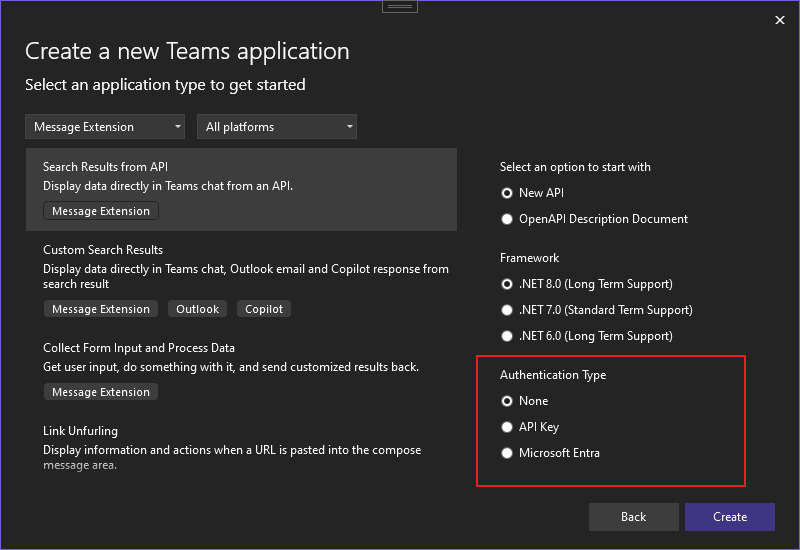
Teams Toolkit now offers an empty Teams template for you to connect with your existing projects or use it as a starting point for new Teams apps.
- Start with this empty template to create any Teams app.
- If you want to add Teams capability to your existing project, add Empty Teams App to your project and then connect two projects by making simple edits follow https://aka.ms/Config-Teams-app.
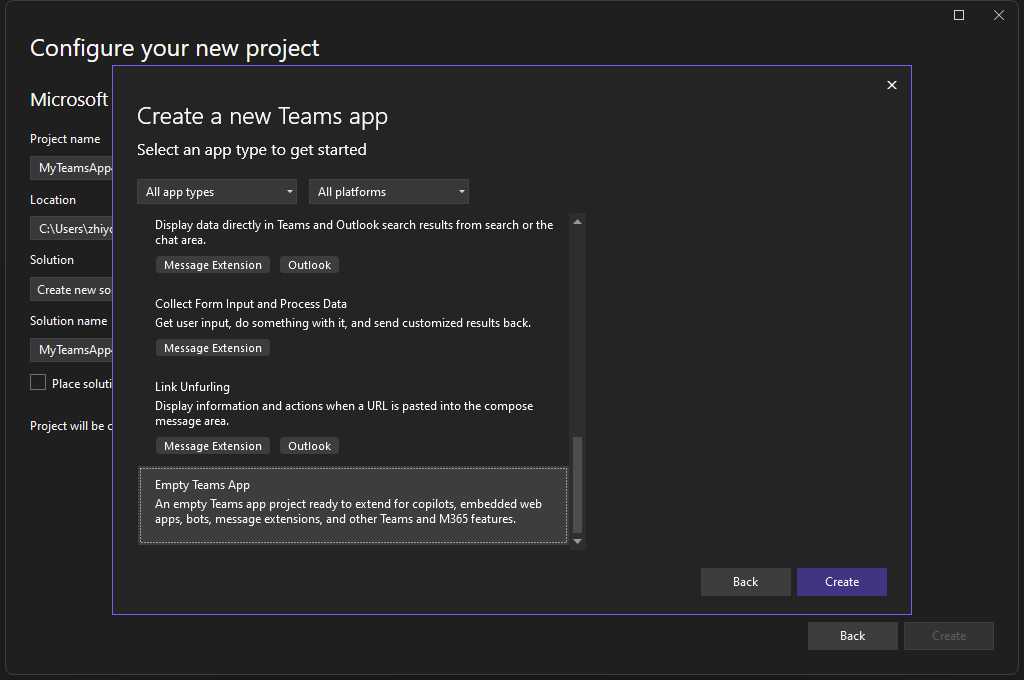
Teams Toolkit supports authentications for Search Results from API Message Extensions app.
Improved user authentication
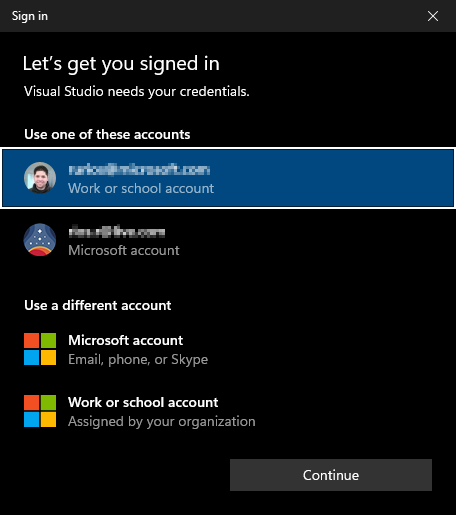
Visual Studio now uses the Windows authentication broker otherwise known as WAM as the default authentication mechanism.
Visual Studio now uses the Web Account Manager (WAM) as its main authentication mechanism. This integration not only streamlines the authentication experience for Visual Studio, but it also enhances the security of your credentials.
Here's how the new WAM experience looks like:
How does this impact your experience?
Using WAM as the default authentication experience has many benefits, including:
- Windows integration: In addition to reducing the overall number of authentication prompts, you can now select existing Windows accounts instead of repeatedly entering credentials.
- Better token protection: Refresh tokens are better secured as they are now device bound.
- Support for the latest security features:
- Leverage rich OS capabilities such as Windows Hello & FIDO keys.
- Access the latest and greatest Microsoft Entra ID capabilities and conditional access policies.
Web
Discover dynamic Web API routes
The Endpoints Explorer has been updated to discover endpoints at runtime.
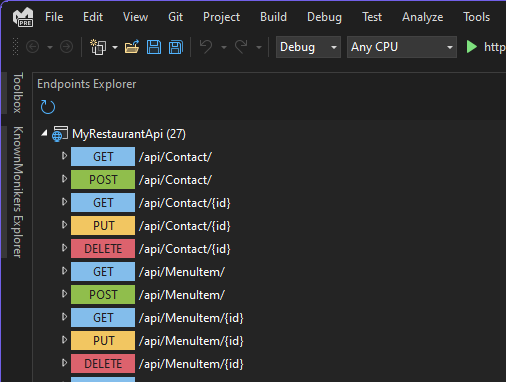
When working with ASP.NET Core Web APIs you can use the Endpoints Explorer to view and interact with the endpoints.
The Endpoints Explorer discovers endpoints statically to show the initial set of endpoints. There are some endpoints which cannot be statically discovered. For example, any endpoint defined in a class library project is one example. There are other ways to register endpoints which cannot be discovered statically.
When you run or debug your Web API, Visual Studio will also discover routes at runtime and add those to the Endpoints Explorer.
📣 See feature ticket to share your feedback and continue the conversation.
NPM packages in Solution Explorer
See your NPM packages show up under the Dependencies node in Solution Explorer.
We unified the NPM experiences you get in ASP.NET and JavaScript and TypeScript projects. You will therefore now also see your NPM packages listed in Solution Explorer for JavaScript and TypeScript projects.
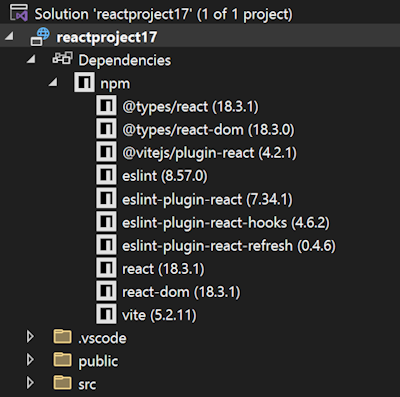
This is the same experience you get for NuGet, but now for NPM as well.
Gaming
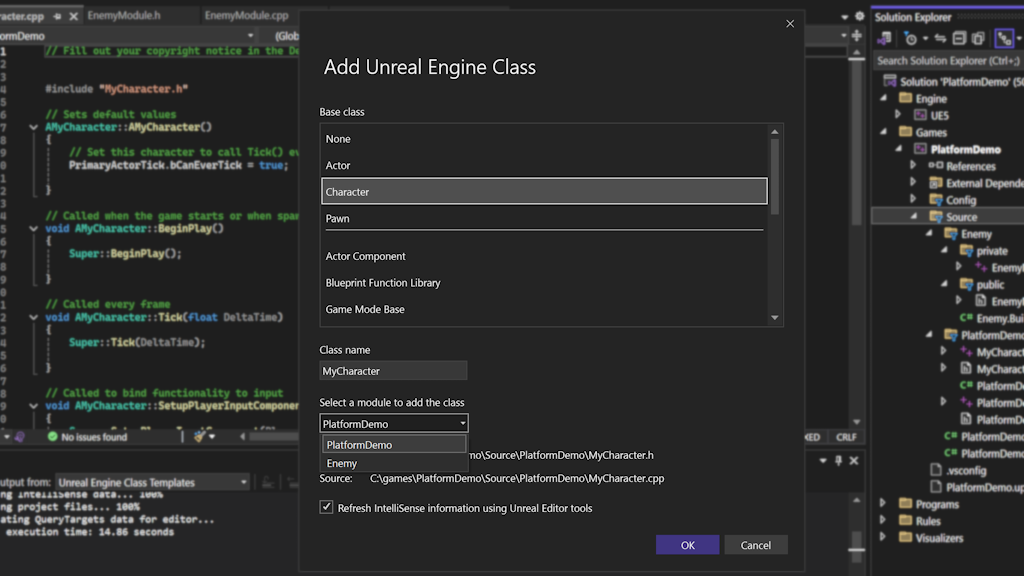
Unreal Engine Add Class Templates
Add common Unreal Engine class templates to your project with the new Add Class.
You can now add additional common Unreal Engine class templates to your project with the new Add Class dialog. This dialog provides a list of common Unreal Engine class templates that you can add to your project. You can also now add your class to a module of your choosing.
To get started, right click on the project in Solution Explorer and select Add > Unreal Engine Item. In the Add New Item dialog, select Unreal Engine Common Classes to open the Add Class dialog.
📣 See feature ticket to share your feedback and continue the conversation.
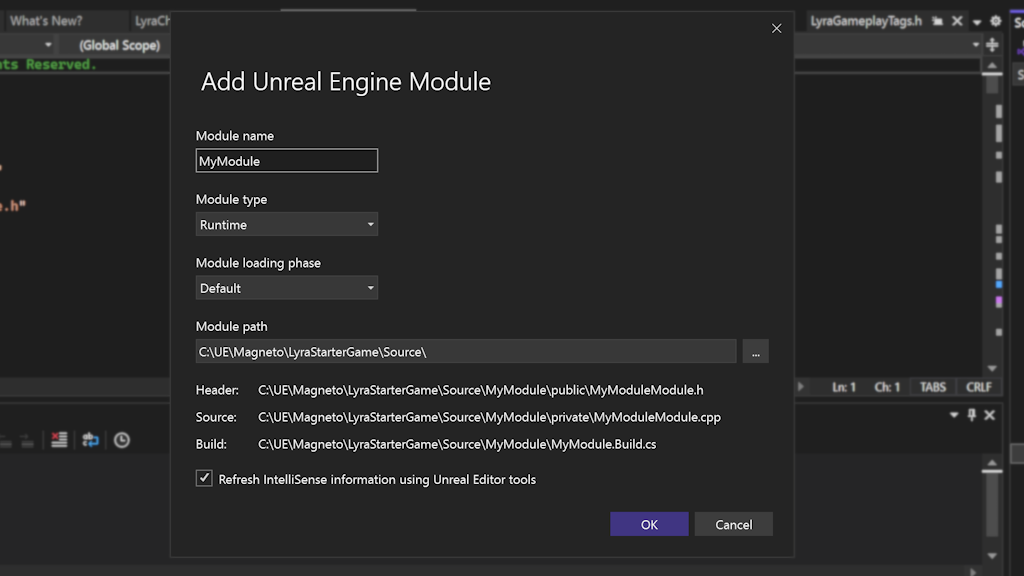
Unreal Engine Add Module
Add Unreal Engine modules to your project with the new Add Module.
You can now add Unreal Engine modules to your project with the new Add Module dialog.
To get started, right click on the project in Solution Explorer and select Add > Unreal Engine Items. In the Add New Item dialog, select Empty Unreal Engine Module to open the Add Module dialog.
📣 See feature ticket to share your feedback and continue the conversation.
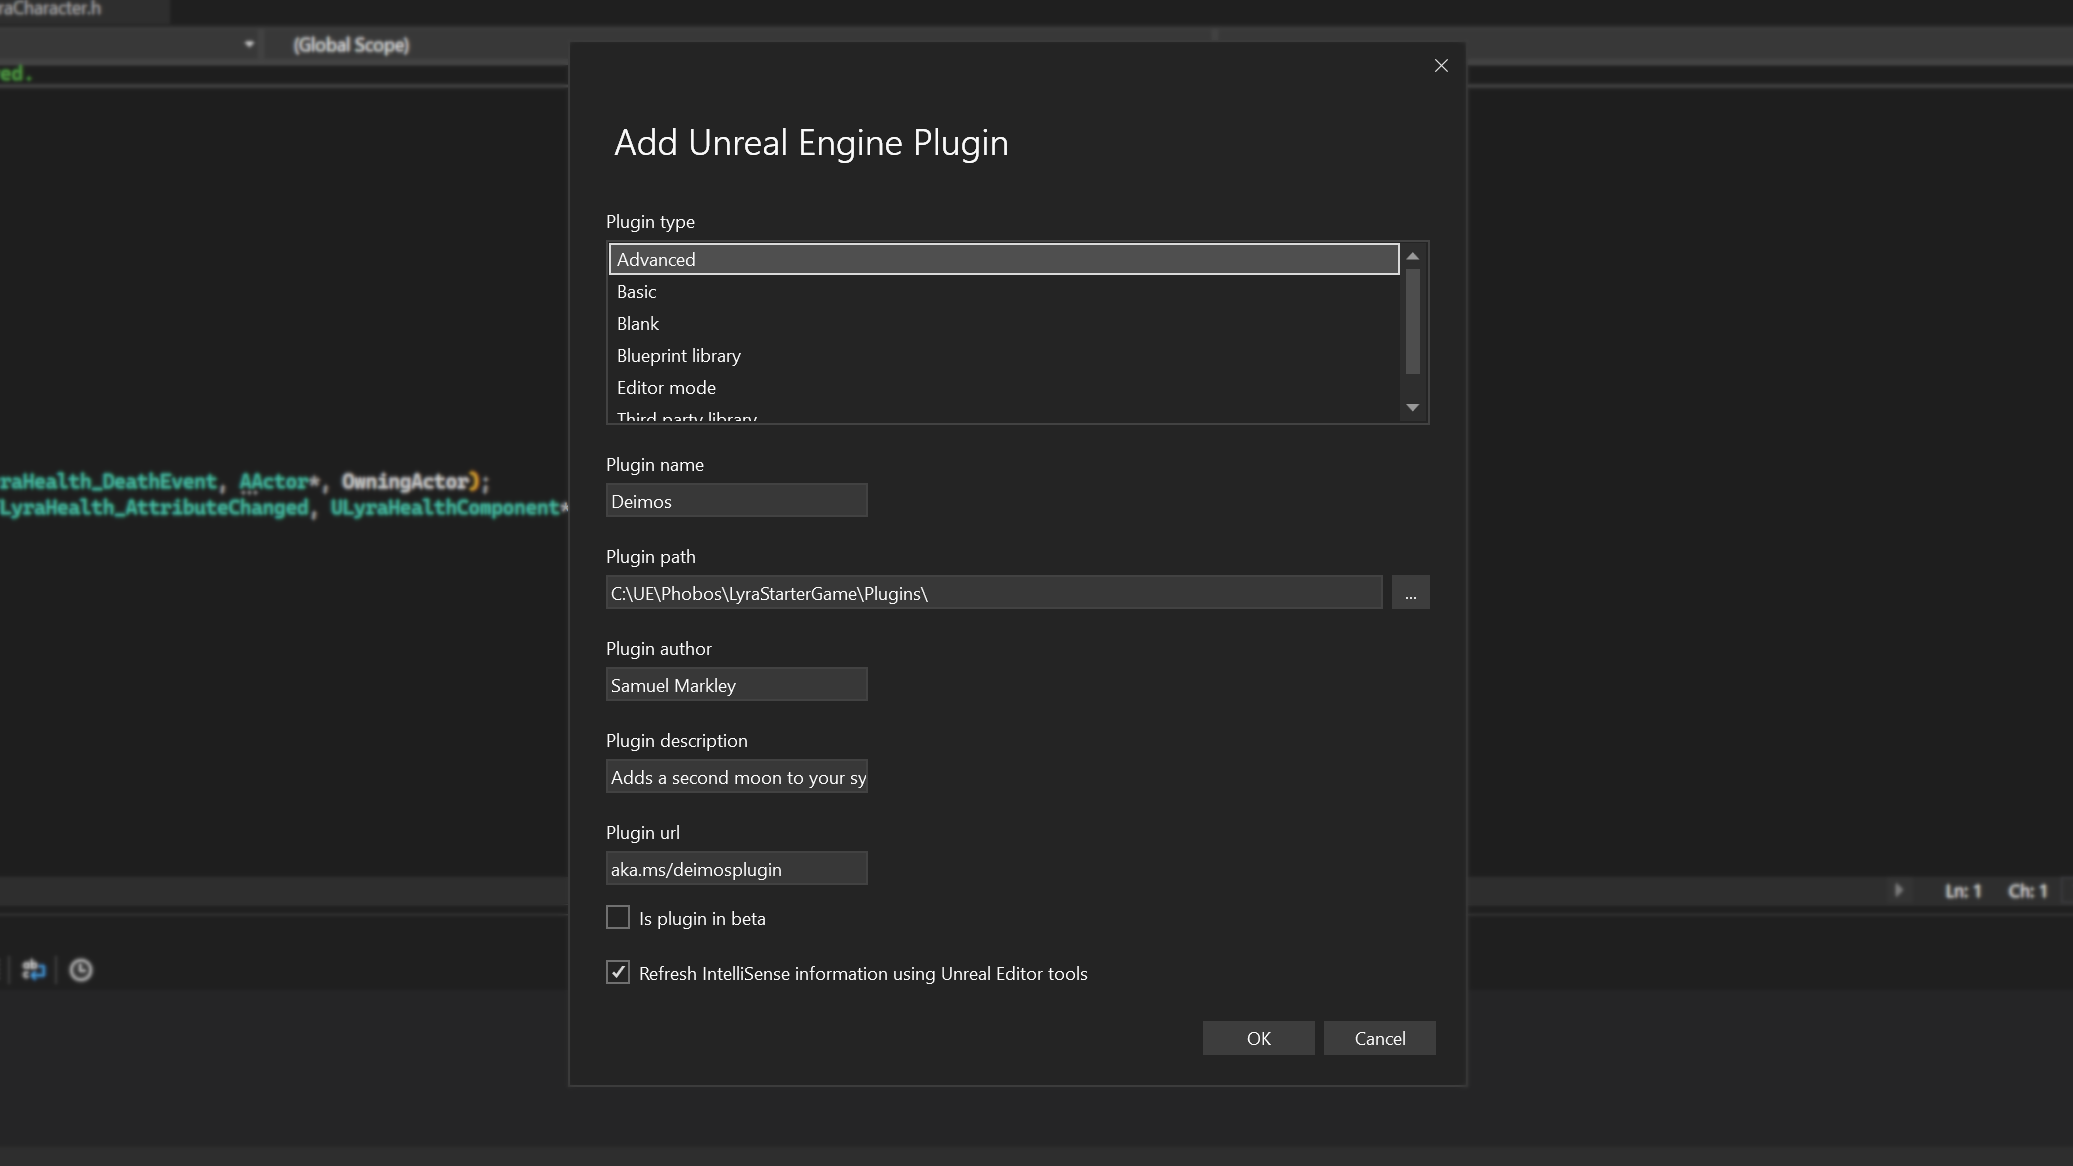
Unreal Engine Add Plugin
Add Unreal Engine plugins to your project with the new Add Plugin.
You can now add Unreal Engine plugins to your project with the new Add Plugin dialog.
To get started, right click on the project in Solution Explorer and select Add > Unreal Engine Item. In the Add New Item dialog, select Unreal Engine Plugins to open the Add Unreal Engine Plugin dialog.
Unreal Engine Toolbar
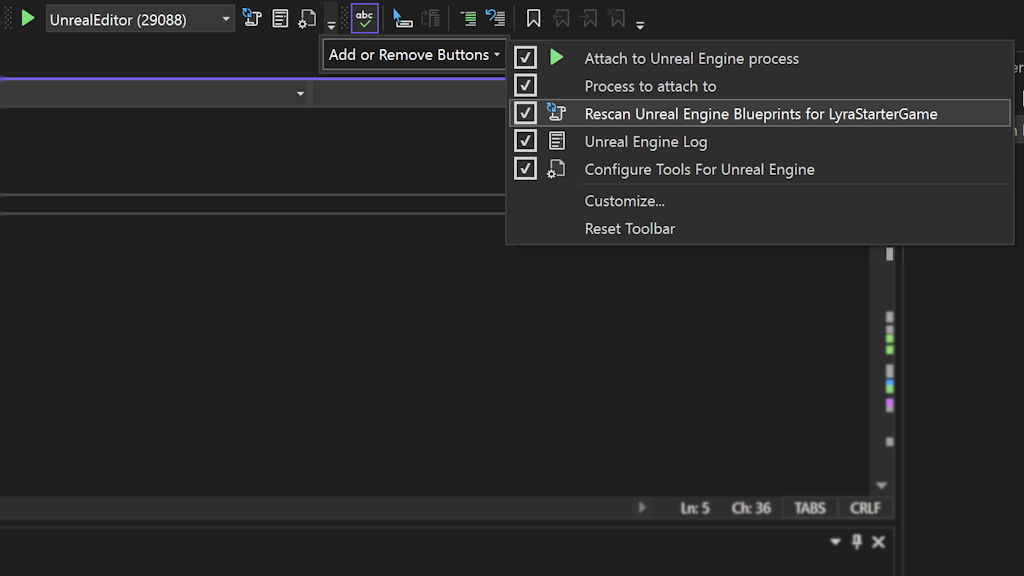
Quickly access Unreal Engine related actions via a dedicated toolbar.
The new Unreal Engine toolbar provides quick access to Unreal Engine related actions. The toolbar is available when you have an Unreal Engine project loaded in Visual Studio. The toolbar includes the following actions:
- Quicky attach to Unreal Engine processes
- Rescan Blueprints Cache
- Quick Access to Unreal Engine Log
- Quick Access Unreal Engine Configuration Page for Visual Studio
.NET
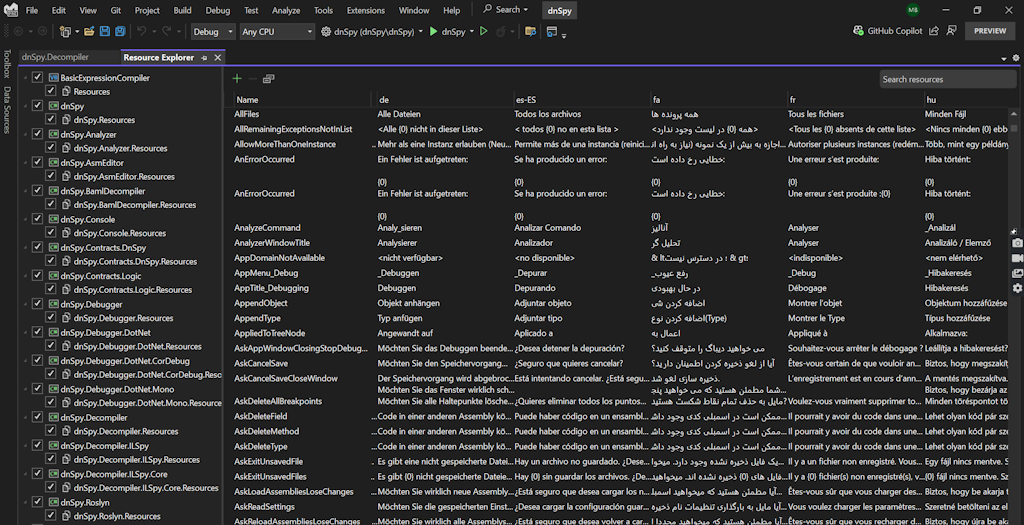
Revamped Resource Explorer
The brand new Resource Explorer makes it easier than ever to manage your .resx files in .NET.
In this version of Visual Studio, we're introducing a revamped Resource Explorer UI to better accommodate the needs of the modern .NET developer.
In this update we made the following improvements:
- Multi-resource view: You can now load multiple files and view all localizations at once within the same view.
- Search and filter: We have added search to make finding resources in large solutions a breeze.
- Comments: Each translation of a resource now has its own comment, all visible at once in the data grid. Look for the small triangle icon in the corner of each cell with a comment.
- Warnings: Placeholder validation and missing translation warnings.
- Accessibility and UI: We have improved the compatibility with screen readers and assistive technology, added zoom functionality to the data grid, and now allow VS Theming for the editor (including dark mode).
📣 See feature ticket to share your feedback and continue the conversation. And take this survey to help make the feature even better.
C++
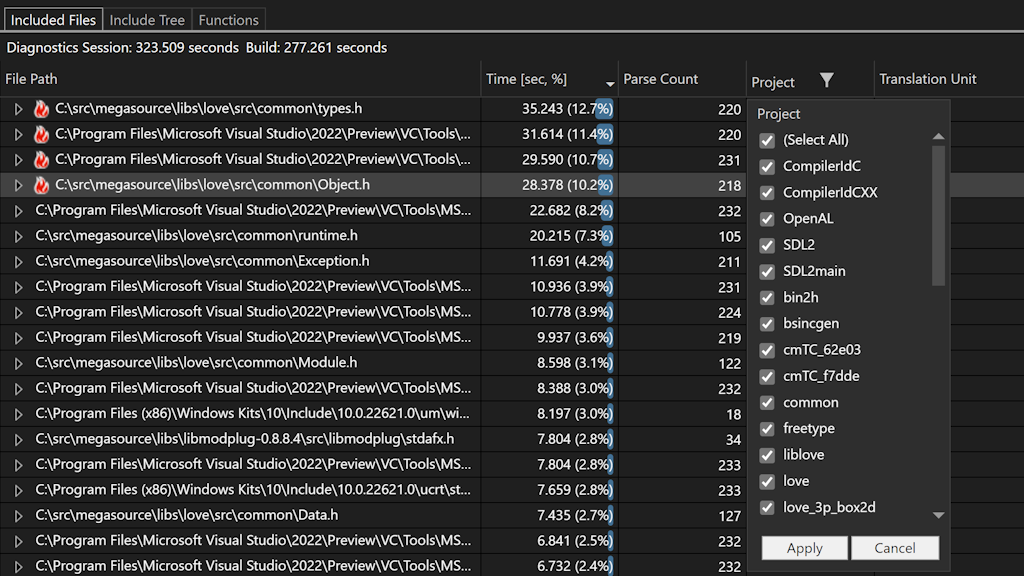
Build Insights QoL Update
Adds various quality of life improvements to C++ Build Insights.
In this update, we added quality of life changes to C++ Build Insights integration. You can now filter your Build Insight trace results by project. For results in each row, you will now see the relative path and file name instead of the full path. We have also improved the grouping of results in the Included Files view.
Debug your CMake projects on Linux
Debug your CMake scripts for projects targeting Linux using WSL and SSH.
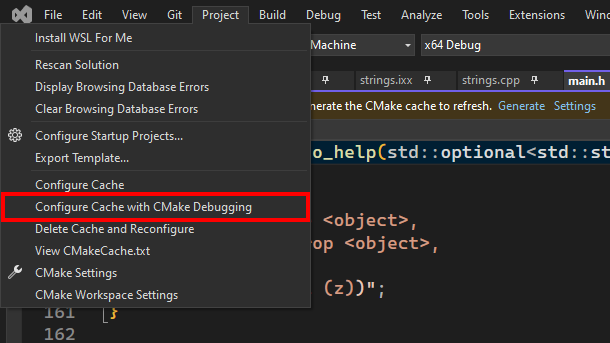
We have added support for the CMake debugger in CMake projects targeting Linux via WSL or SSH. The CMake debugger allows you to debug your CMake scripts and CMakeLists.txt files through the Visual Studio debugger.
To start a CMake debugging session, set a breakpoint in your CMakeLists.txt file and then navigate to Project > Configure Cache with CMake Debugging.
📣 See feature ticket to share your feedback and continue the conversation.
Custom Clang-Tidy Executable
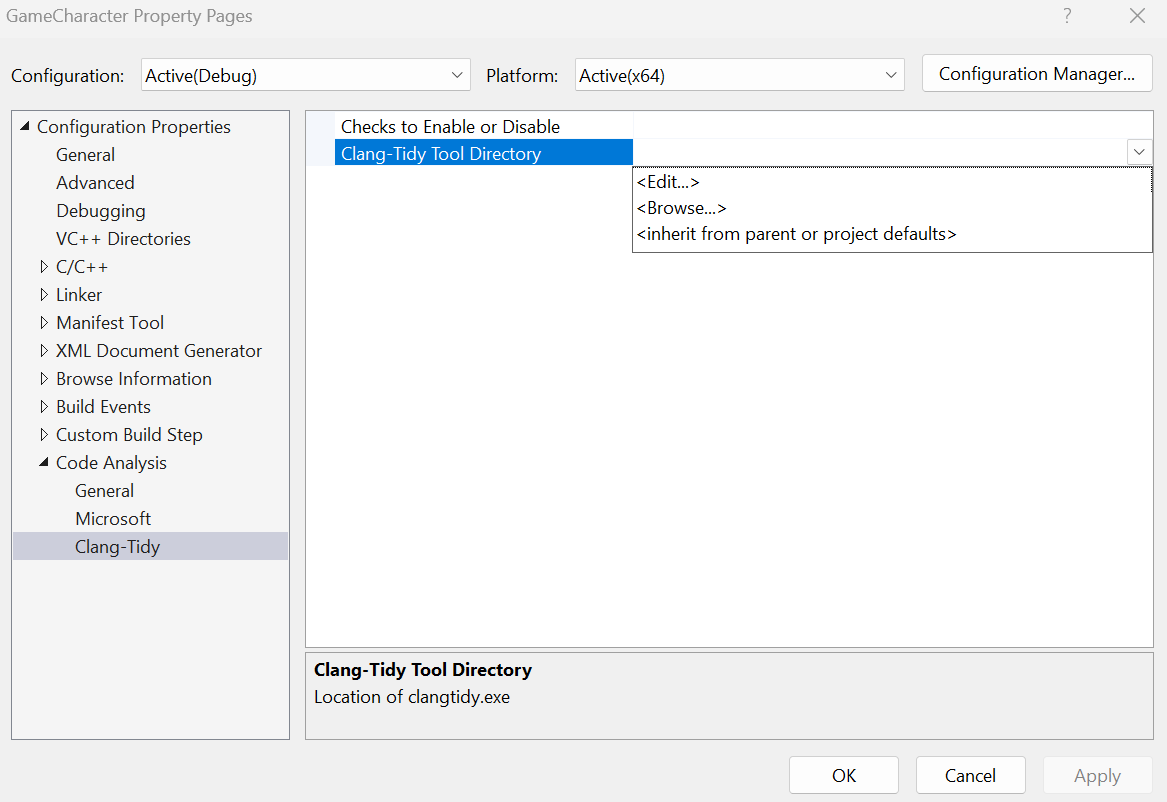
Integrate your custom clang-tidy tool into all projects.
You can now use a custom clang-tidy executable for all your projects. This lets you run clang tidy on individual projects with your own custom rules, without relying on the default clang-tidy executable.
This global setting allows you to integrate your custom clang-tidy rules seamlessly, without the need to overwrite the existing clang-tidy executable.
To activate this feature, navigate to Configuration Properties > Code Analysis > Clang-Tidy and input its path directly or use the Browse option in the Clang-Tidy Tool Directory property. Save the changes and recompile your app for the new executable to take effect.
Version 17.11.6
Released Novmeber 12th, 2024
| Security advisories addressed | CVE |
|---|---|
| .NET Remote Code Execution Vulnerability | CVE-2024-43498 |
| .NET Denial of Service Vulnerability | CVE-2024-43499 |
| Visual Studio Elevation of Privilege | CVE-2024-49044 |
Version 17.11.5
Released October 8th, 2024
| Top bug fixes | From the community |
|---|---|
| .NET for iOS/tvOS/macOS/macCatalyst release notes. | |
| Updated the Windows 11 SDK (10.0.26100.0) installed by Visual Studio to the October 2024 servicing build. | |
| Error MSB4057 in Visual Studio 2022 17.11.0 | Feedback ticket |
| Error when adding class to project. | Feedback ticket |
| MEF component issues with AWS Toolkit with Amazon Q extension. | Feedback ticket |
| Security advisories addressed | CVE |
|---|---|
| .NET Denial of Service Vulnerability in System.Security.Cryptography.Cose, System.IO.Packaging, System.Runtime.Caching | CVE-2024-43483 |
| .NET Denial of Service Vulnerability in System.IO.Packaging | CVE-2024-43484 |
| .NET Denial of Service Vulnerability in System.Text.Json 6.0.x and 8.0. | CVE-2024-43485 |
| Denial of Service Vulnerability in Visual Studio Collector Service | CVE-2024-43603 |
| Elevation of Privilege Vulnerability in Visual Studio C++ Redistributable Installer | CVE-2024-43590 |
Version 17.11.4
Released September 17th, 2024
| Top bug fixes | From the community |
|---|---|
| System.NullReferenceException when copying files within Solution Explorer. | Feedback ticket |
| Fixed an issue where responding to solution events can cause incomplete state to be read from the projects. | |
| Fixed ArgumentNullException iOS remote build error when switching between different SDK versions (including Xamarin). | Feedback ticket |
| VS now includes MAUI 8.0.82 (SR8.2). | |
| Always display error and stop debugging when using Debug.Restart (Ctrl+Shift+F5). | Feedback ticket |
| Fixed an issue that caused .NET builds to fail after installing .NET SDK 9.0.100-rc.1 or newer. | |
| This fix addresses the scenario where the addition of a GitHub account without copilot license puts copilot into an error state, which causes copilot to be unavailable for use. | Feedback ticket |
| Adding a conditional breakpoint causes an unconditional crash. | Feedback ticket |
| Resource explorer cannot open resx files. | Feedback ticket |
| Go to definition doesn't work. | Feedback ticket |
Version 17.11.3
Released September 10th, 2024
| Top bug fixes | From the community |
|---|---|
| Can't Publish .Net Framework Applications After 17.11.0 Update. | Feedback ticket |
| Cannot pair to Mac after Visual Studio 17.11.0 update. | Feedback ticket |
| 17.11.0 Error output breaks tests. |
| Security advisories addressed | CVE |
|---|---|
| SQL Server Native Client OLE DB Provider Remote Code Execution Vulnerability | CVE-2024-35272 |
Version 17.11.2
Released August 27th, 2024
| Top bug fixes | From the community |
|---|---|
| Fixed Visual Studio Installer failure when installing PackageId:AndroidPlatformMAUI2. |
Version 17.11.1
Released August 20th, 2024
| Top bug fixes | From the community |
|---|---|
| Visual Studio 2022 (64-bit) Version 17.11.0 Preview 6.0 corrupts stack on stopping debugging a native application. | Feedback ticket |
| Xamarin Profiler has been deprecated and removed from Visual Studio. | |
| Xamarin.Android Designer is scheduled for deprecation and will be removed in a future update. |
Tip
If there are any features you'd like to see in future updates to Visual Studio, please let us know by submitting a feature ticket.
Note
Our roadmap shows the priorities and direction for the future of Visual Studio, so make sure to check it out.
Note
This update may include new Microsoft or third-party software that is licensed separately, as set out in the 3rd Party Notices or in its accompanying license.
From all of us on the team, thank you for choosing Visual Studio. If you have any questions, please reach us on Twitter or Developer Community.
Happy coding!
The Visual Studio team