Visual Studio 2022 Preview release notes
We're excited to announce the availability of Visual Studio 2022 v17.14. This update focuses on stability and security, along with AI improvements for all developers.
Download Visual Studio 2022 v17.14 Preview to enjoy these new features and improvements.
Features
All the new features in the latest preview release.
GitHub Copilot
GPT-4o code completion model
Introducing the GPT-4o Copilot code completion model in public preview to bring you higher quality completions.
We are thrilled to announce that the new GPT-4o Copilot code completion model is now available in Visual Studio 17.14 for GitHub Copilot users! This advanced model, based on GPT-4o mini, has been further trained on over 275,000 high-quality public repositories across more than 30 popular programming languages. As a result, developers can look forward to more accurate suggestions and enhanced performance.
To experience the new model, navigate to Tools → Options → GitHub → Copilot → Copilot Completions and select GPT-4o Copilot from the model picker dropdown. You can also access the settings by clicking the GitHub Copilot Badge in the top right corner and going to Settings → Options. Please note that there might be a delay in retrieving the latest model list for the first time. If you don't see the new model in the dropdown, try restarting Visual Studio.
GPT-4o Copilot access notes:
- Copilot Pro users: The new model is available for you now in 17.14 and later.
- Copilot Business or Enterprise users: Your administrator needs to enable this model for your organization first by opting in to Editor preview features in the Copilot policy settings on github.com.
- Copilot Free users: Using this model will count toward your 2,000 free monthly completions.
Important
Activate GitHub Copilot Free and unlock this and other AI features. No trial. No credit card. Just your GitHub account.
AI doc comment generation
Automatically generate doc comments for C++ and C# functions.
Copilot is now seamlessly integrated into Visual Studio's code editor to assist you in generating doc comments for functions.
With automatic doc comment generation enabled for your project, simply type the comment pattern according to your settings configuration (e.g.,
///), and Copilot will automatically complete the function description based on the function's content.
This feature is available for both C++ and C# project files.
Important
Activate GitHub Copilot Free and unlock this and other AI features. No trial. No credit card. Just your GitHub account.
Debugging & diagnostics
New debugger for .NET MAUI apps
New Mono debug engine for .NET MAUI integrated into the Visual Studio Core debugger.
The new Mono debugger for .NET MAUI apps is a new debug engine integrated into the Visual Studio debugger, that brings important improvements in terms of reliability, performance and feature parity with the rest of Visual Studio.
Just My Code, variables and expression evaluation are among the most noticeable improvements.
In order to use it, make sure you have the following Visual Studio Preview feature enabled: Enable new .NET Mono debugger for MAUI apps
This feature is only available for the Android platform. iOS support is coming soon.
Show datatips for LINQ Expressions 📣
Enhanced LINQ expression debugging experience with clause hovering datatip.
Generating and troubleshooting LINQ queries can be a tedious and intricate process, often requiring precise syntax knowledge and countless iterations. To alleviate these challenges, Visual Studio 2022 now features a LINQ on-hover DataTip in its debugger.
While you are in a break state during debugging, you can hover over individual clauses or segments of your LINQ query and evaluate the immediate query value at runtime.
In addition, you can click the GitHub Copilot icon at the end of the DataTip, which will perform an Analyze with Copilot on the specific query clause you hovered over. Copilot then explains the clause's syntax and clarifies why you are getting the specified result.
This can significantly improve efficiency and make your debugging experience smoother and easier, helping you pinpoint issues regarding to LINQ queries faster and streamline your overall development workflow.
📣 See feature ticket to share your feedback and continue the conversation.
Zero-Length Array Allocation Insights
The .NET Allocation Tool now identifies zero-length array allocations, helping optimize memory usage and performance.
The .NET Allocation Tool now provides detailed insights into zero-length array allocations, helping you identify and optimize unnecessary memory usage. While these allocations may seem insignificant, they can accumulate and impact performance, especially in high-performance or memory-constrained applications.
With this update, you can investigate zero-length array allocations by clicking the Investigate link, which opens the Allocation View displaying allocation details. Double-clicking reveals code paths where these allocations occur, enabling precise optimizations. To improve efficiency, consider using
Array.Empty<T>(), a statically allocated empty array instance, to eliminate redundant memory allocations.
Git tooling
View Outgoing / Incoming Commits 📣
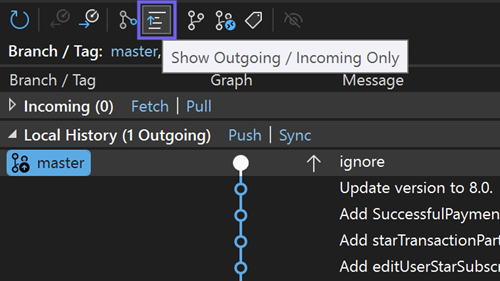
The Git Repository window now provides a filter at its toolbar to show only outgoing / incoming commits.
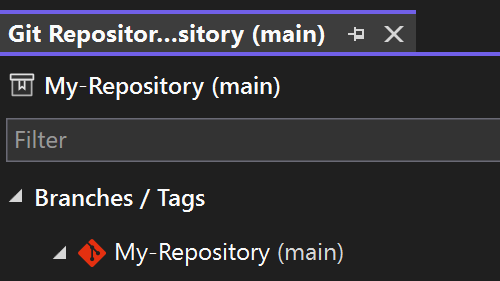
The Git Repository window is the go-to place to understand your Git history. As you work on a local branch, it may get out of sync with your remote, either because you created new commits (outgoing) or there are new commits to pull (incoming).
With the new outgoing / incoming filter available in the toolbar, you can spot such unsynced commits instantly. Your commits, their commits – scan them with ease and stay in perfect sync!
📣 See feature ticket to share your feedback and continue the conversation.
Restore the Git repository window 📣
Keep the Git Repository window open between restarts with this new setting.
As your dedicated environment for branch operations, the Git Repository window is likely at the core of your day-to-day development. If you find yourself frequently reopening it with every Visual Studio session, this update is designed to save you time and effort.
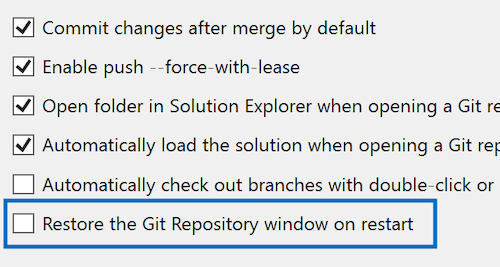
We've added a new setting to Git > Settings to automatically restore the Git Repository window when restarting Visual Studio. Additionally, the window will be included in your saved window layouts, enhancing your customization options.
By default, this feature is off to keep things running smoothly for those who don't need it. But if you like the convenience, this setting is perfect for you.
📣 See feature ticket to share your feedback and continue the conversation.
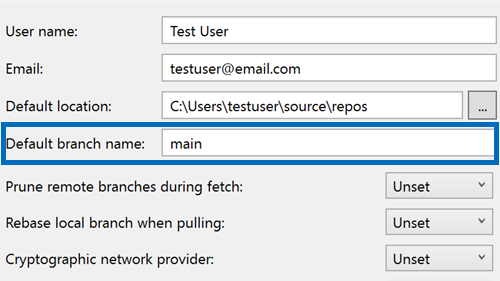
Default branch name 📣
Allow users to customize the initial default branch when a new git repository is created.
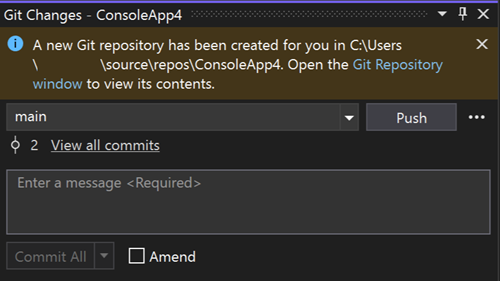
You can now effortlessly set the default branch name for new Git repositories directly through Visual Studio. This new setting communicates seamlessly with your Git configuration, making it easier to customize your workflow.
Just head to Git > Settings and the next time you create a repository you can see your custom branch name in action.
📣 See feature ticket to share your feedback and continue the conversation.
IDE
Enhanced NuGet Authentication
NuGet now provides context when asking you to provide credentials.
We've improved the NuGet authentication process. Now, if we detect any potential authentication issues, you'll see a new authentication dialog that provides context about the feed and the specific account needs.
This update enhances the reauthentication process for multi-factor authentication (MFA) scenarios, resolves issues with consecutive authentication prompts, and ensures a smoother overall experience when managing private NuGet feeds.
Teams Toolkit Update
Teams Toolkit added new projects templates for building agents.
We're excited to announce that in this release Teams Toolkit added project templates for building Declarative Agents for Microsoft Copilot.
You can create a Declarative Agent with or without an action. You can choose to define new APIs or utilize existing ones to define the action performing tasks or retrieving data.
Use Teams Toolkit to debug and preview your Declarative Agents in Microsoft Copilot.
What's more, in this release Teams Toolkit refreshed all project templates to support .NET 9.
Happy coding!
The Teams Toolkit Team
Preserve font preferences across themes 📣
Changing themes will now preserve your font and font size preferences.
We understand that the fonts developers select when coding is a personal choice, influenced by preferences for readability, accessibility, or aesthetics. Visual Studio themes primarily focus on presentation colors and are independent of your preferred fonts.
With this update, we've introduced functionality to retain your font face and size choices when switching themes. You can now set your font preferences once and switch themes in Visual Studio without needing to reconfigure your font settings every time. Note that the colors of your fonts remain linked to the theme, as that is the purpose of themes, but your font selections will be preserved.
This feature will be enabled by default for all users. If you prefer the previous behavior, go to Tools → Manage Preview Features and find the option Separate font settings from color theme selection. If this option is checked, your font preferences will be maintained regardless of theme changes. Uncheck the box to reinstate the previous behavior which ties font choices to theme.
📣 See feature ticket to share your feedback and continue the conversation.
Desktop
Update your UI, live at design time 📣
Live Preview, Hot Reload, and other UI tools are now available at design time.
Live Preview is now available at design time, allowing real-time visualization of changes in your app UI. Hot Reload and other live UI tools can now be used in this manner as well, ensuring a seamless workflow.
The flexibility to use these tools when detached from the debugger allows for uninterrupted experimentation and refinement of your designs.
Click on the new Live Preview indicator to access Live Preview at design time from any XAML file:
Whether you're working on a new .NET MAUI app or refining an existing WPF app, these enhancements will help you deliver high-quality applications faster and with greater confidence.
📣 See feature ticket to share your feedback and continue the conversation.
New UWP .NET 9 MSTest project template 📣
Visual Studio now includes an updated UWP MSTest project template targeting .NET 9 and Native AOT.
Visual Studio now includes a new UWP MSTest project template targeting .NET 9 and Native AOT. We worked closely with the MSTest team to add all necessary support for UWP .NET 9 projects to the MSTest libraries and infrastructure, and to the Visual Studio test host. This now enables UWP test projects to target .NET 9 and leverage all the modern .NET SDK and MSTest tooling, while still running in a UWP context as you'd expect.
Just like all other original UWP project templates using .NET Native, the previous UWP MSTest project template will continue to be available. However, it is recommended to use the new project templates targeting .NET 9 and Native AOT going forwards. Like we did in Visual Studio 17.13, we have further adjusted the ordering of all UWP templates to reflect this, and prioritize the new .NET 9 project templates in the search results.
📣 See feature ticket to share your feedback and continue the conversation.
Extensibility
Install extension packs
The installer can now handle the installation of extension packs.
The installer now supports Extension Packs, which are bundles of multiple extensions all referenced from a single extension.
To use Extension Packs in the Installer, first specify the desired extensions in a .vsconfig file. Then, use the Visual Studio Installer's Import Configuration feature to import the .vsconfig file containing your extension details.
For more information on creating or generating .vsconfig files, refer to the installation configurations documentation.
After importing the .vsconfig file, you'll be directed to the modify screen where extensions will be grouped under their own heading in the installation summary pane. Here, you can select or deselect entire Extension Packs or individual extensions within any Packs.

Data
Use SDK-style SQL projects in SSDT 📣
You can now use the SDK-style project file format in your SQL Server Data Tools projects with enhanced SQL debugging and schema comparison capabilities.
The update in Visual Studio 17.14 introduces additional item templates and .dacpac database references to SDK-style SQL Server Data Tools (preview). SDK-style SSDT SQL projects are based on the Microsoft.Build.Sql SDK, which brings cross-platform support and improved CI/CD capabilities to SQL Server Data Tools (SSDT) projects.
With less verbose project files and database references to NuGet packages, teams can more efficiently collaborate on large databases in a single project or compile multiple sets of objects from several projects. Database deployments from a Microsoft.Build.Sql project can be automated in Windows and Linux environments where the Microsoft.SqlPackage dotnet tool publishes the build artifact (.dacpac) from the SQL project. Learn more about SDK-style SQL projects and DevOps for SQL.
In 17.14, database references are expanded to support project and .dacpac artifact references. Support for database references as package references will come in a future release. A recent release of the slngen solution file generator also added support for Microsoft.Build.Sql projects, enabling managing large solutions programmatically.
Make sure to install the latest SSDT preview component in the Visual Studio installer to use the SDK-style SQL projects in your solution.
📣 See feature ticket to share your feedback and continue the conversation.
C++
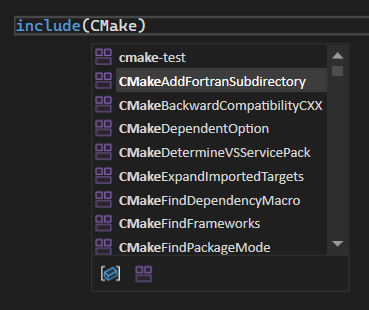
Quick Info support for CMake modules
Added support for CMake modules in IntelliSense Quick Info and Completion.
We have added support for IntelliSense-based completions and quick info for CMake modules in Visual Studio. Now, you can view all available CMake modules and learn more, directly from the Visual Studio editor.
Quick Info
When you hover over a referenced CMake module, IntelliSense can provides more information on the selected module.
Completion
When you start typing a CMake module in your
CMakeLists.txtor other CMake script files, IntelliSense will provide a list of available modules to choose from.
Top user-reported bug fixes
- Error with String::Format in C++ CLR Class Library (.NET) project
- False positive lifetime code analysis warning C26847: Don't return an invalid pointer
- Regression in 17.12.0: Substitution Failure Is An Error C3699 when compiling with /CLR
- Sanitizer Coverage Produces Bad Codegen
- Compilation error in lambda expressions in hierarchies with virtual inheritance
- Installer fails update to 17.12.0 with powershell script execution error
- Solution explorer exception when changing solution
📣 See the full list of all the user-reported bug fixes that made it into this release.
Important
A breaking change has been made to Domain-Specific Language model serialization. Developers using the default serialization mechanism for their models that contain custom property types will need to add TypeConverters for those custom property types. For an example of how to do this, see Customizing File Storage and XML Serialization.
From our entire team, thank you for choosing Visual Studio! For the latest updates, resources, and news, check out the Visual Studio Hub and stay in touch.
Happy coding!
The Visual Studio team
Note
This update may include new Microsoft or third-party software that is licensed separately, as set out in the 3rd Party Notices or in its accompanying license.


