Tutorial: Create a Node.js and Express app in Visual Studio
This article demonstrates how to use Visual Studio to build a basic Node.js web app that uses the Express framework.
Node.js is a server-side JavaScript runtime environment that executes JavaScript code. By default, Node.js uses the npm package manager to make it easy to use and share Node.js source code libraries. The npm package manager simplifies the installation, updating, and uninstallation of libraries.
Express is a server web application framework that Node.js uses to build web apps. With Express, there are many different ways to create a user interface. The implementation provided in this tutorial uses the Express application generator's default template engine, called Pug, to render the frontend.
In this tutorial, you:
- Create a Node.js app by using a JavaScript template
- Build the app and examine the running process
- Debug the app in the Visual Studio debugger
Prerequisites
Visual Studio 2022 version 17.12 or later with the ASP.NET and web development workload installed.
To install Visual Studio for free, go to the Visual Studio downloads page.
If you already have Visual Studio, you can install the workload from within the Interactive Development Environment (IDE):
Select Tools > Get Tools and Features.
In the Visual Studio Installer, select the Workloads tab.
Select the ASP.NET and web development workload, and then select Modify.
Follow the prompts and complete the installation.
Node.js with the npm package manager and the npx package.
You can check your Node.js installation with the
node -vcommand. The command output should show the installed version of Node.js, such asv23.4.0. For more information, see Downloading and installing Node.js and npm.The npm package manager is included in the Node.js installation. Verify the installation with the
npm -vcommand. The command output should show the installed version of the package manager, such as10.9.2.The npx package is part of the npm CLI. Confirm the package installation with the
npx -vcommand. The command output should show the installed package version, such as10.9.2.
Create your app
Follow these steps to create a new Node.js app in Visual Studio:
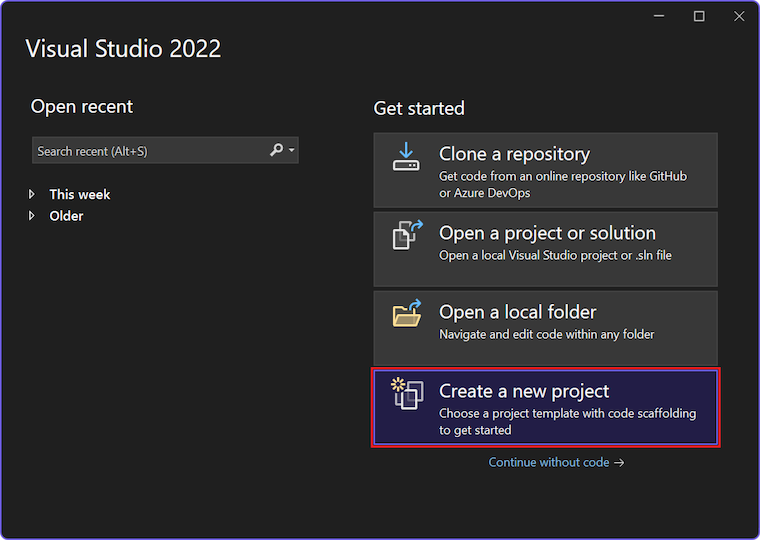
In the Visual Studio Start window (File > Start Window), select Create a new project:

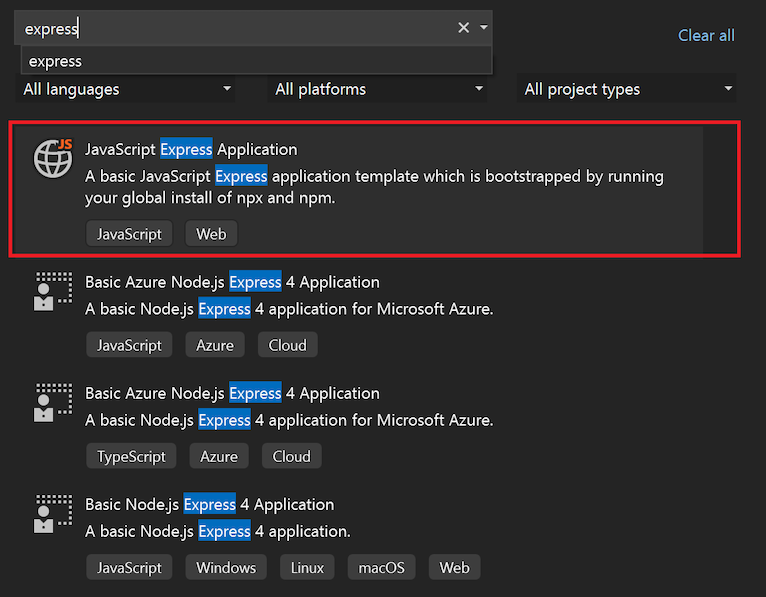
In the Search box, enter Express, and select the JavaScript Express Application template in the list of results:

Select Next to continue to the configuration page.
Enter a Project name and Solution name for your new app. Choose the default Location or browse to a different path in your environment.
Select Create to create the new Node.js project.
Visual Studio creates your new project and opens your project hierarchy in Solution Explorer.
View your project properties
The default project settings allow you to build and debug the project. You can change the settings as needed.
In Solution Explorer, right-click the project and select Properties. You can also access these properties by selecting Project > ExpressProject Properties.
In the Project Properties pane, go to the Build section and configure the properties as desired.
To configure debug settings, select Debug > ExpressProject Debug Properties.
Note
The launch.json file stores the startup settings associated with the Start action in the Debug toolbar. Currently, the launch.json must be located in the .vscode folder.
Build your project
Build your project by selecting Build > Build Solution.
Start your app
Start your new app by selecting Ctrl + F5 or Start Without Debugging (green arrow outline icon) in the toolbar.
A terminal opens and shows the executing command:
> expressproject@0.0.0 start
> node ./bin/www

GET / 200 29342.066 ms - 170
GET /stylesheets/style.css 200 18.967 ms - 111
Note
Check the terminal output for messages. Also check the Output pane in Visual Studio. Watch for instructions to update your version of Node.js.
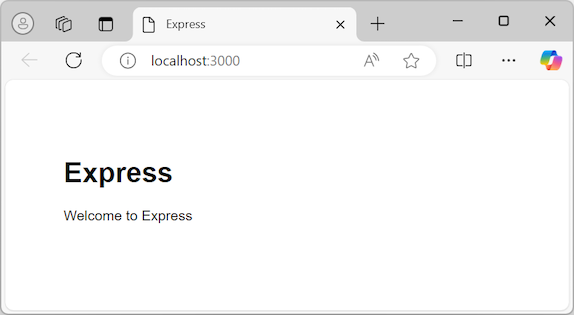
When the app launches successfully, a browser window opens showing the Express app:

Debug your app
Now you're ready to explore ways to debug your app.
If your app is still running, select Shift + F5 to end the current session or Stop  (red square icon) in the Debug toolbar. You might notice that ending the session closes the browser that shows your app, but the terminal window running the Node process remains open. For now, go ahead and close any lingering windows. Later in this article, you review scenarios for when you might want to leave the Node process running.
Debug the Node process
The dropdown list to the left of the Start action shows available start options for the app:
- localhost (Edge)
- localhost (Chrome)
- Launch ExpressProject
- Launch Node and Browser
Follow these steps to debug the Node process for the app:
In the Start dropdown list, select Launch Node and Browser.
In Solution Explorer, expand the routes folder and open the index.js file.
In the code editor, set a breakpoint in the index.js file:
Locate the code statement
res.render('index', { title: 'Express' });.Select in the left gutter on the line for the statement. Visual Studio adds a red circle in the gutter to indicate the set breakpoint.
Tip
You can also place your cursor on a line of code and select F9 to toggle the breakpoint for that line.
Start your app in the debugger by selecting F5 or Start Debugging
 (green arrow icon) in the Debug toolbar.
Visual Studio starts execution of your app. When the debugger reaches your set breakpoint, the debugging process pauses.
While execution is paused, you can inspect the state of your app. Hover over variables and examine their properties.
When you're ready to continue, select F5. Processing continues and your app opens in the browser.
This time, if you select Stop, notice that both the browser and terminal windows close. To understand why the behavior is different, take a closer look at the launch.json file.
Examine the launch.json file
Follow these steps to examine the launch.json file for the project:
In Solution Explorer, expand the .vscode folder and open the launch.json file.
Tip
If you don't see the .vscode folder in Solution Explorer, select the Show All Files action in the Solution Explorer toolbar.
Take a look at the file in the code editor. If you have experience with Visual Studio Code, the launch.json file probably looks familiar. The launch.json file in this project corresponds to the file used by Visual Studio Code to denote launch configurations used for debugging. Each entry specifies one or more targets to debug.
Examine the first two entries in the file. These entries define behavior for different internet browsers:
    {
      "name": "localhost (Edge)",
      "type": "edge",
      "request": "launch",
      "url": "http://localhost:3000",
      "webRoot": "${workspaceFolder}\\public"
    },
    {
      "name": "localhost (Chrome)",
      "type": "chrome",
      "request": "launch",
      "url": "http://localhost:3000",
      "webRoot": "${workspaceFolder}\\public"
    }
The supported browsers are indicated with the
typeproperty. If you launch the app with only a browser type as the sole debug target, Visual Studio debugs only the front-end browser process. The Node process starts without a debugger attached. Visual Studio doesn't bind any breakpoints set in the Node process.Note
Currently,
edgeandchromeare the only supported browser types for debugging.When you end the session, the Node process continues to run, by design. The process is intentionally left running when a browser is the debug target. If work is solely being done on the frontend, having the backend process continuously running eases the development workflow.
At the start of this section, you closed the lingering terminal window so you could set breakpoints in the Node process. To enable Visual Studio to debug the Node process, the process must be restarted with the debugger attached. If a nondebuggable Node process is left running, attempting to launch the Node process in debug mode (without reconfiguring the port) fails.
Review the third entry in the launch.json file. This entry specifies
nodeas the debug type:{ "name": "Launch ExpressProject", "type": "node", "request": "launch", "cwd": "${workspaceFolder}/bin", "program": "${workspaceFolder}/bin/www", "stopOnEntry": true }The third entry launches only the Node process in debug mode. Visual Studio doesn't launch the browser.
Examine the fourth entry in the launch.json file, which defines a compound launch configuration:
    {
      "name": "Launch Node and Browser",
      "configurations": [
        "Launch ExpressProject",
        "localhost (Edge)"
      ]
    }
This compound configuration is the same as a Visual Studio Code compound launch configuration. When you select this configuration, you can debug both the frontend and backend. Notice that the definition simply references the individual launch configurations for the Node and browser processes.
There are many other attributes you can use in a launch configuration. For example, you can hide a configuration to remove it from the Start dropdown list, but allow references to the configuration by setting the
hiddenattribute in thepresentationobject totrue:{ "name": "localhost (Chrome)", "type": "chrome", "request": "launch", "url": "http://localhost:3000", "webRoot": "${workspaceFolder}\\public", "presentation": { "hidden": true } }Configure options by using supported attributes to enhance your debugging experience. Currently, only launch configurations are supported. Any attempt to use an attach configuration results in a deployment failure. For more information, see Options.