View and change variable values with data tips in the code editor
This article explores how to work with the data tips feature in Visual Studio. Data tips provide a convenient way to view information about variables in your program while you debug your code. When you set breakpoints in your code and start debugging, data tips are visible for variables as they enter the current scope of execution. You can use the data tip to change the value for a variable in scope, and rerun the code over the breakpoint to see the effect of the change.
Tip
If you're new to debugging, you might want to read Debugging for absolute beginners and Debugging techniques and tools before you work through this article.
Prerequisites
Visual Studio. If you don't have Visual Studio, go to the Visual Studio downloads page to install it for free.
Some program code to run in the Visual Studio debugger.
Work with data tips
Data tips are visible during a debugging session when you have breakpoints set in your code. When the debugger pauses program execution at a breakpoint, data tips are available for any variables in the current scope.
Here's the process:
Set a breakpoint in your code, and start debugging by selecting Debug > Start Debugging or use the F5 keyboard shortcut.
When the debugger pauses execution at the breakpoint, hover over any variable in the current scope to open the data tip.
Use the data tip to see the name of the variable and work with the value.
As needed, change the value for a variable or add comments.
Note
Visual Studio evaluates and displays the value for the variable in a data tip based on the context where the debugger is paused on execution. Evaluation isn't based on the current location of the cursor or data tip. If you hover over a variable in another function that has the same name as a variable in the current context, Visual Studio displays the value of the variable in the data tip for the current context.
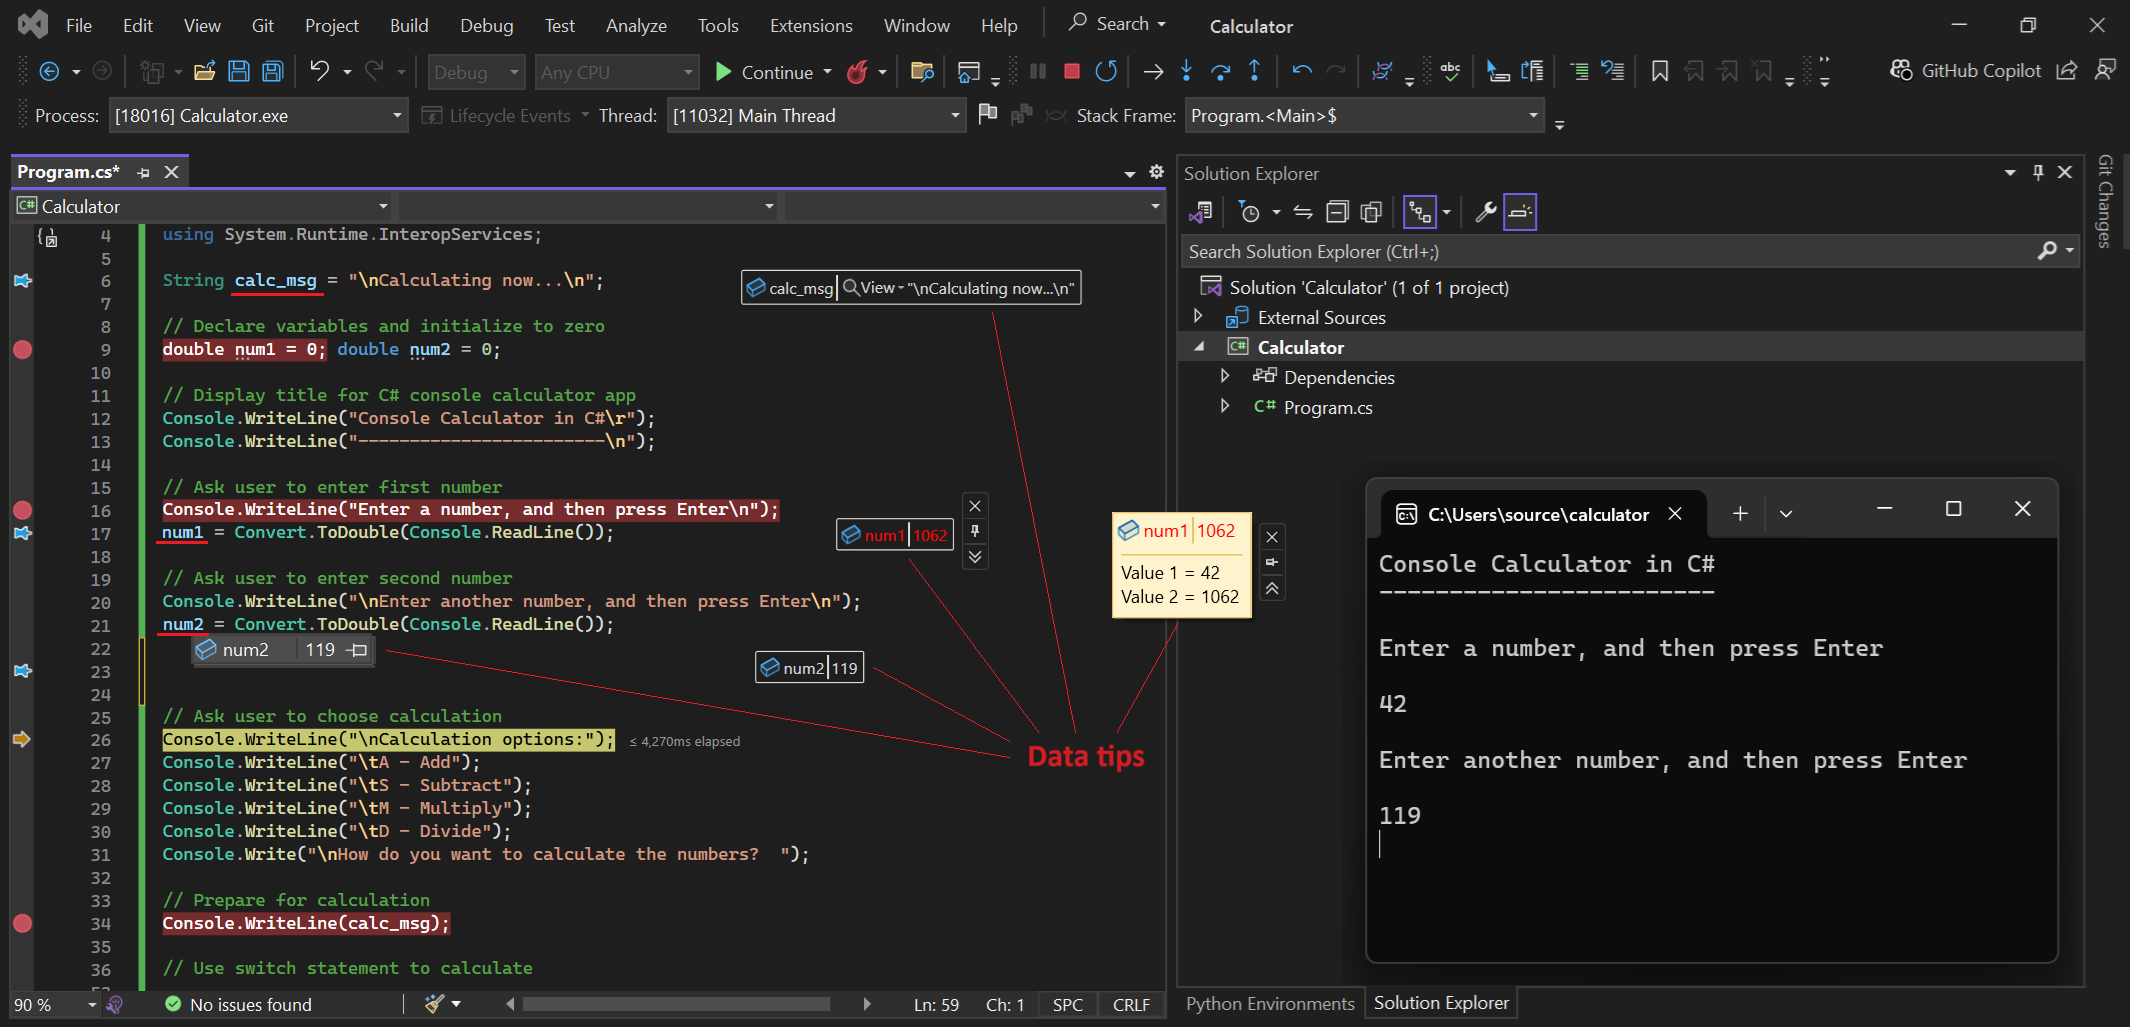
Visual Studio supports many actions for data tips and working with the variables and values, including:
- Pin or float a data tip to keep it visible as code execution continues
- Enable sticky data tips that remain expanded until you select elsewhere
- Expand the data tip for an array, structure, or object to view its members in a tree format
- Change the value for a variable in a data tip
- Add multiline comments to a pinned data tip for note taking during debugging
- Import and export data tips
Make data tips transparent
When you hover over a variable to view the data tip, you can make the data tip transparent to see the code underneath. This action also turns on transparency for other tip actions in the code editor, such as method definitions and expression syntax.
To enable transparency, follow these steps:
In the Visual Studio Code editor, select inside a data tip, and then select and hold Ctrl.
To maintain transparency, continue to hold Ctrl.
To end transparency, stop selecting Ctrl or select elsewhere.
Transparency isn't available for a pinned or floating data tip.
Keep data tips expanded
In Visual Studio 2022 Update 1 and later, when you expand a data tip, you can keep it expanded until you select elsewhere. This action produces a sticky data tip.
To make a data tip sticky, follow these steps:
In Visual Studio, select Debug > Options to open the Options dialog.
In the General tab, scroll to locate the Keep expanded data tips open until clicked away option.
Select the checkbox to enable the sticky option, and select OK.
When the sticky option is enabled, if you expand any data tip in the code editor, it remains expanded.
Pin data tips
You can pin a data tip to keep it open on the code editor surface. You can also change the location of the pinned data tip.
To pin a data tip, follow these steps:
In the Visual Studio Code editor, hover over a variable to show the data tip.
In the data tip, use the pushpin to select Pin to source:

Visual Studio pins the data tip to a place nearby the variable on the code surface. A pushpin appears in the gutter of the code editor next to the line where you pin the data tip.
Select and drag the pinned data tip to any location on the code editor surface.
Float (unpin) data tips
After you pin a data tip, you can unpin the data tip and make it float. A floating data tip can be positioned anywhere in the Visual Studio IDE.
To float a data tip, follow these steps:
In a pinned data tip, use the pushpin to select Unpin from source.
Visual Studio unpins the data tip and gives the data tip a solid color background. The pushpin for the data tip changes to the unpinned position, and the pushpin in the gutter of the code editor is removed.

Select and drag the floating data tip to any location in the Visual Studio IDE.
If you position the floating data tip outside the code editor surface, the pushpin is removed from the data tip side menu. The Pin to source option is available only when the floating data tip is positioned on the code editor surface.
Repin data tips
After you float a data tip, you can repin it to a specific source location on the code editor surface.
To repin a floating data tip, follow these steps:
Select and move the floating data tip, and position it on the code editor surface.
In the floating data tip, use the pushpin to select Pin to source.
The pushpin changes to the pinned position. The data tip is repinned to a specific location in the code editor, and a pushpin for the source appears in the gutter of the code editor.
Close data tips
There are several ways you can close data tips in Visual Studio.
When you end your debugging session, if you have any open data tips, Visual Studio closes them for you. If you launch another debugging session, Visual Studio tries to reestablish any data tips that you previously left open.
The following table summarizes how you can manually close data tips:
| Close target | Action |
|---|---|
| Specific data tip | Select the X in the data tip. |
| All data tips for specific file | Select Debug > Clear All DataTips Pinned to <Filename> on the Visual Studio toolbar. |
| All open data tips | Select Debug > Clear All DataTips on the Visual Studio toolbar. |
Work with variables and values in data tips
When you work with data tips in Visual Studio, you gain the ability to see details about variables and objects, and edit values during debugging. These capabilities are useful for quick troubleshooting and testing changes to your code.
Expand objects in data tips to view members
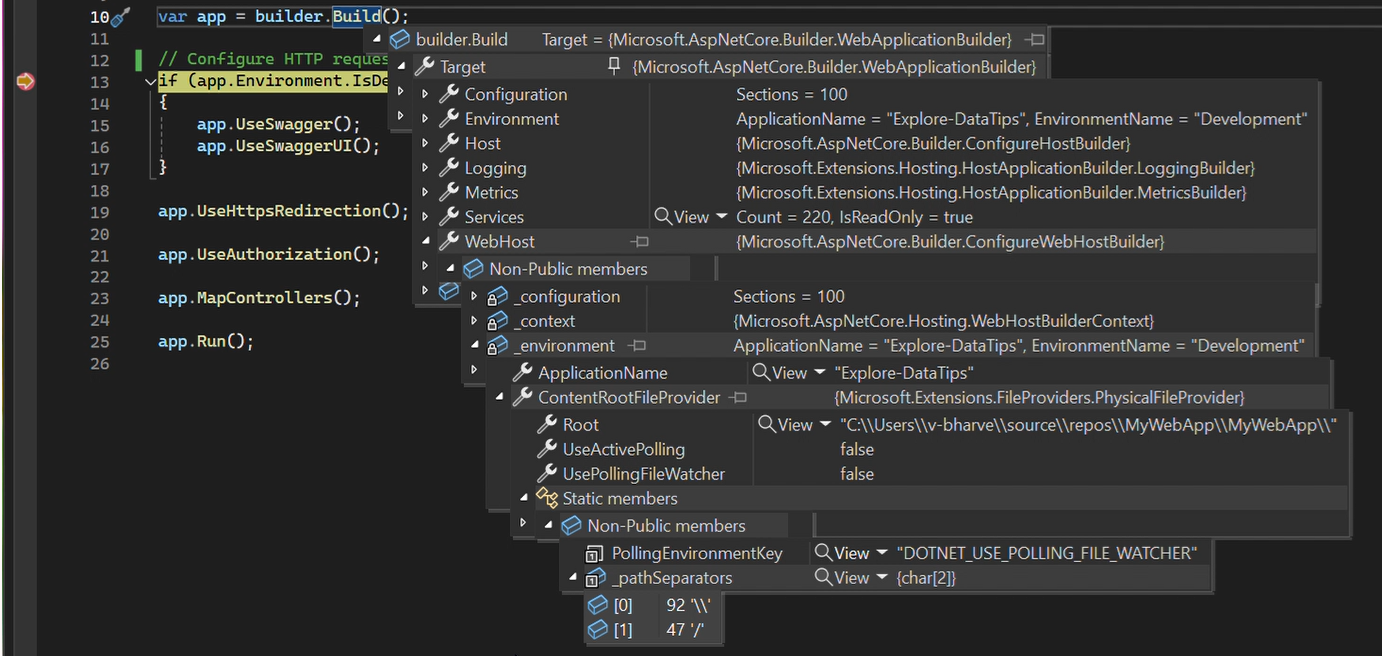
When a data tip represents an array, structure, or object, you can expand the data tip view to see the members. The expanded view shows the extra information in a hierarchical tree format.
To expand the view for an object in a data tip, follow these steps:
In a data tip for an array, structure, or object, select the expand arrow before the item name to show the members. The view is presented in a tree format:

For a pinned data tip, select the plus symbol (+) before the variable name to expand the definition.
Continue to select the expand arrows to view more of the member hierarchy:
To move up and down in the expanded view, use the mouse or keyboard Up and Down arrow keys.
To pin an expanded member with the original pinned data tip, use the pushpin on the member to select Pin to source. After you collapse the tree view, any pinned member elements remain visible with the pinned data tip.
Edit variable values
Another advantage of working with data tips is the ability to edit the value of a variable or element in a data tip during debugging. This functionality is useful for quick testing of small changes to your code.
To edit the value of a variable or element in a data tip, follow these steps:
In the data tip, select the value. Visual Studio highlights the value and makes it available for editing.
Enter a new value in the data tip, and select Enter.
Keep in mind that some variable values are read only. Visual Studio doesn't make read-only values available for editing.
Use comments in data tips
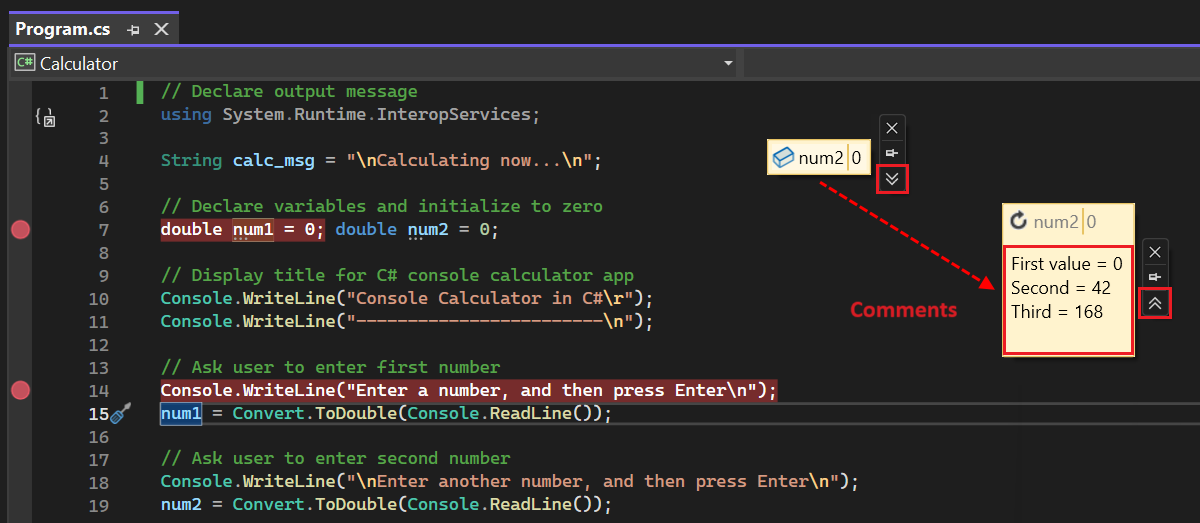
The Comments region of a data tip is useful for keeping notes about variables as you debug your code. This region is a convenient place to track different values as they change during debugging. You can add comments in a pinned or floating data tip.
To use Comments in a data tip, follow these steps:
In the data tip, use the double Down arrow to select Expand to see comment. The double down arrow opens the Comments region of the data tip where you can add notes.
To add a comment, insert your cursor in the Comments region and enter text. The region accepts multiple lines.
To close the Comments region, use the double Up arrow to Collapse comments. Any comments you enter remain with the data tip, but they're not currently visible.
Pin properties in data tips
Visual Studio supports pinning properties in pinned data tips in .NET Core 3.0 and later. This feature lets you quickly inspect objects by their properties in data tips.
To pin properties in data tips, follow these steps:
In a pinned data tip, expand the hierarchy of members until you see a property that you want to keep visible with the data tip.
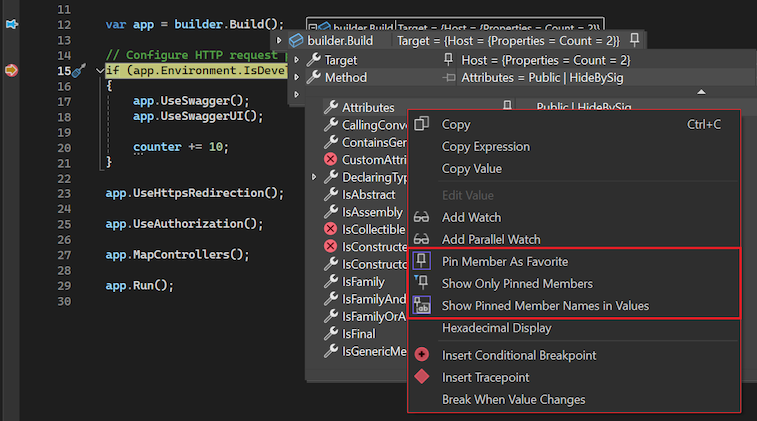
Use the pushpin for the property to pin it with the data tip. You can also right-click the property and select Pin Member As Favorite.
Visual Studio moves the selected property to the top of the object's property list. The property name and value display in the right column of the pinned data tip:

To unpin a property in a data tip, select the pushpin for the property again, or right-click the property and select Unpin Member As Favorite.
You can also toggle visibility of property names and filter out unpinned properties in the object's property list in a data tip:
To filter out unpinned properties, right-click the property row in the data tip, and select Show Only Pinned Members.
To toggle visibility of property names, right-click the property row in the data tip, and select Hide Pinned Member Names in Values.
The following image shows the various options on the right-click menu for the member hierarchy in a data tip:

Get AI assistance
If you have Copilot, you can get AI assistance while you're looking at variables in data tips. Right-click on a variable and use the Ask Copilot  button. In this scenario, Copilot already knows the context for your question, so you don't need to provide context yourself in chat. For more information, see Debug with Copilot.
Visualize complex data types
Visualizers display information in a more meaningful, and sometimes graphical, manner. Examples of visualizers include XML, HTML, JSON, and the Text Visualizer. You can use visualizations to examine complex data types in your code during debugging.
If visualizers are available for an element, Visual Studio displays the View magnifying glass next to the element name in the data tip. When you select a visualization, Visual Studio opens a separate window to display the complex data in a readable format.
You can use this feature to select a visualization for your data:
To view the element by using the default visualizer for the data type, select the magnifying glass.

To select a specific visualizer, expand the View dropdown list next to the magnifying glass and choose an option.
Add variables to Watch windows
You can continue to watch variables by adding them to a Visual Studio Watch window from a data tip:
- In the data tip, right-click the variable name and select Add Watch.
Visual Studio adds the variable in the Watch window. If your Visual Studio edition supports multiple Watch windows, the variable appears in the window labeled Watch 1.
Import and export data tips
You can export data tips to an XML file, which you can share or edit by using a text editor. You can also import a data tips from an XML file you received or previously edited.
To export data tips, follow these steps:
In Visual Studio, select Debug > Export DataTips. The Export DataTips dialog opens.
In the dialog, browse to the location where you want to save the XML file.
Enter a name for the export file, and select Save.
Visual Studio exports your data tips to the specified file and location.
To import data tips from a file, follow these steps:
In Visual Studio, select Debug > Import DataTips. The Import DataTips dialog opens.
In the dialog, browse to the location of the data tips XML file to use for the import.
Select the file to open, and select Open.
Visual Studio imports the data tips from the specified file into your current workspace. When you debug the workspace code, the imported data tips are available.


