Use the Memory windows in the Visual Studio debugger (C#, C++, Visual Basic, F#)
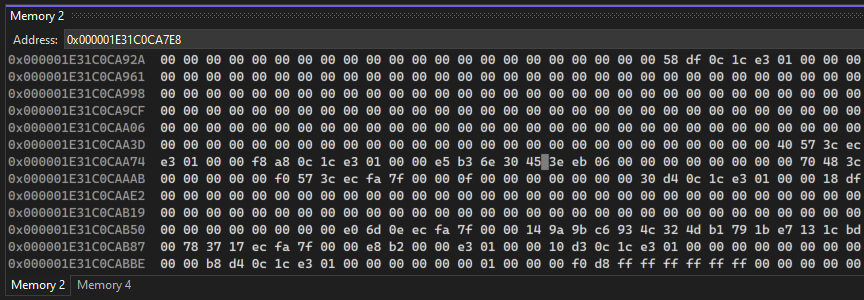
During debugging, the Memory window shows the memory space your app is using.
Debugger windows like Watch, Autos, Locals, and the QuickWatch dialog show you variables, which are stored at specific locations in memory. The Memory window shows you the overall picture. The memory view is convenient for examining large pieces of data (buffers or large strings, for example) that don't display well in the other windows.
The Memory window isn't limited to displaying data. It displays everything in the memory space, including data, code, and random bits of garbage in unassigned memory.
The Memory window isn't available for script or SQL debugging. Those languages don't recognize the concept of memory.
Open a Memory window
Like other debugger windows, the Memory windows are available only during a debugging session.
Important
To enable the Memory windows, Enable address-level debugging must be selected in Tools > Options (or Debug > Options) > Debugging > General.
Open a Memory window:
Make sure Enable address-level debugging is selected in Tools > Options (or Debug > Options) > Debugging > General.
Start debugging by selecting the green arrow, pressing F5, or selecting Debug > Start Debugging.
Under Debug > Windows > Memory, select Memory 1, Memory 2, Memory 3, or Memory 4. (Some editions of Visual Studio offer only one Memory window.)
Multiple windows allow you to maintain views for different areas in memory space at the same time.
Move around in the Memory window
The address space of a computer is large, and you can easily lose your place by scrolling in the Memory window.
Higher memory addresses appear at the bottom of the window. To view a higher address, scroll down. To view a lower address, scroll up.
In most scenarios, you want to find a specific memory location.
Find a memory location
You can instantly go to a specified address in the Memory window by using drag-and-drop, or by entering the address in the Address field. The Address field accepts alphanumeric addresses, and expressions that evaluate to addresses, such as e.User.NonroamableId.
To force immediate re-evaluation of an expression in the Address field, select the rounded-arrow Reevaluate Automatically icon.
By default, the Memory window treats Address expressions as live expressions, which are re-evaluated as the app runs. Live expressions can be useful, for example, to view the memory that is touched by a pointer variable.
Use drag and drop to move to a memory location:
In any debugger window, select a memory address, or a pointer variable that contains a memory address.
Drag and drop the address or pointer in the Memory window.
That address appears in the Address field, and the Memory window adjusts to display that address at the top.
Entering a location in the Address field to move to a memory location:
Type or paste the address or expression in the Address field and press Enter, or choose it from the dropdown in the Address field.
That address appears in the Address field, and the Memory window adjusts to display that address at the top.

Customize the Memory window
By default, memory contents appear as 1-byte integers in hexadecimal format, and the window width determines the number of columns shown. You can customize the way the Memory window shows memory contents.
Change the format of the memory contents:
- Right-click in the Memory window, and choose the formats that you want from the context menu.
Change the number of columns in the Memory window:
- Select the dropdown arrow next to the Columns field, and select the number of columns to display, or select Auto for automatic adjustment based on window width.
If you do not want the contents of the Memory window to change as your app runs, you can turn off live expression evaluation.
Toggle live evaluation:
Right-click in the Memory window, and select Reevaluate Automatically in the context menu.
Note
Live expression evaluation is a toggle, and is on by default, so selecting Reevaluate Automatically turns it off. Selecting Reevaluate Automatically again turns it back on.
You can hide or display the toolbar at the top of the Memory window. You will not have access to the Address field or other tools when the toolbar is hidden.
Toggle the toolbar display:
- Right-click in the Memory window, and select Show Toolbar in the context menu. The toolbar appears or disappears, depending on its previous state.
Follow a pointer through memory (C/C++)
In native code apps, you can use register names as live expressions. For example, you can use the stack pointer to follow the stack.
Follow a pointer through memory:
In the Memory window Address field, enter a pointer expression that is in the current scope. Depending on the language, you might have to dereference it.
Press Enter.
When you use a debug command such as Step, the memory address displayed in the Address field and at the top of the Memory window automatically changes as the pointer changes.
View memory pointers (.NET)
If you want to view contents of a .NET object based on a memory pointer, such as an address obtained from a heap snapshot, you can do that using {CLR}@Address notation. The address must be a pointer to memory, such as 0x1D102A581B0. Enter the memory pointer using {CLR}@Address notation in the Memory window Address field. Alternatively, you can use the same notation to add a watch using the Watch window.
To get the memory pointer address from a heap snapshot, open the heap dump, choose Debug Managed Memory, which opens the Memory Usage tool. Right-click the object you're interested in, and choose View instances.