Debug only user code with Just My Code
Just My Code is a Visual Studio debugging feature that automatically steps over calls to system, framework, and other non-user code. In the Call Stack window, Just My Code collapses these calls into [External Code] frames.
Just My Code works differently in .NET and C++ projects.
Enable or disable Just My Code
For most programming languages, Just My Code is enabled by default.
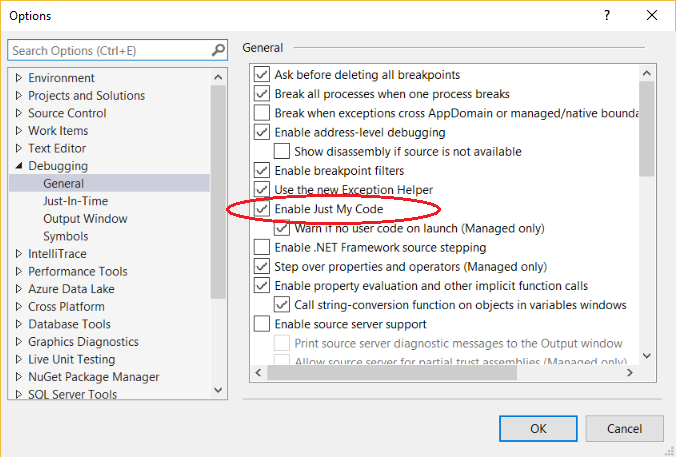
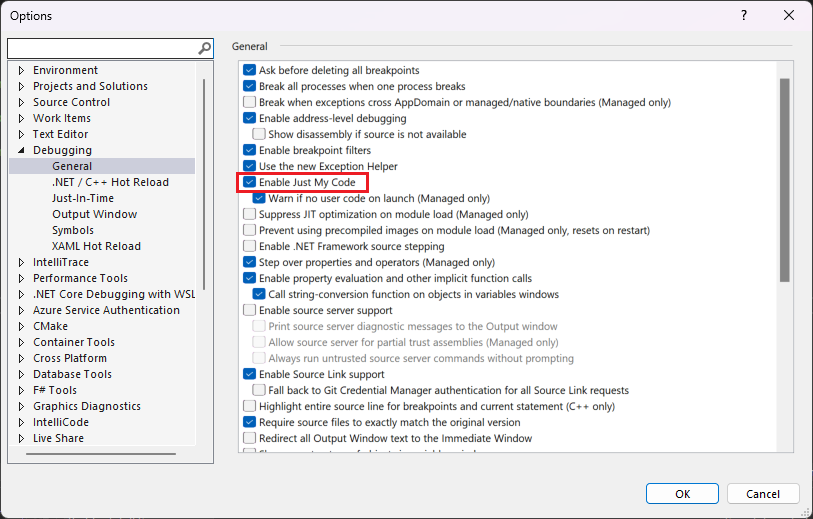
- To enable or disable Just My Code in Visual Studio, under Tools > Options (or Debug > Options) > Debugging > General, select or deselect Enable Just My Code.


Note
Enable Just My Code is a global setting that applies to all Visual Studio projects in all languages.
Just My Code debugging
During a debugging session, the Modules window shows which code modules the debugger is treating as My Code (user code), along with their symbol loading status. For more information, see Get more familiar with how the debugger attaches to your app.


In the Call Stack or Tasks window, Just My Code collapses non-user code into a grayed-out annotated code frame labeled [External Code].


Tip
To open the Modules, Call Stack, Tasks, or most other debugging windows, you must be in a debugging session. While debugging, under Debug > Windows, select the windows you want to open.
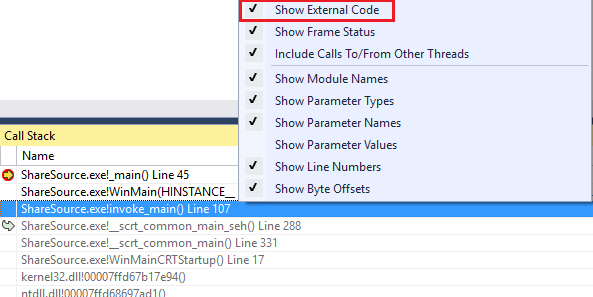
To view the code in a collapsed [External Code] frame, right-click in the Call Stack or Task window, and select Show External Code from the context menu. The expanded external code lines replace the [External Code] frame.


Note
Show External Code is a current user profiler setting that applies to all projects in all languages that are opened by the user.
Double-clicking an expanded external code line in the Call Stack window highlights the calling code line in green in the source code. For DLLs or other modules not found or loaded, a symbol or source not found page may open.
Starting in Visual Studio 2022 version 17.7, you can autodecompile .NET code by double-clicking external code in the Call Stack window. For more information, see Generate source code from .NET assemblies while debugging.
.NET Just My Code
In .NET projects, Just My Code uses symbol (.pdb) files and program optimizations to classify user and non-user code. The .NET debugger considers optimized binaries and non-loaded .pdb files to be non-user code.
Three compiler attributes also affect what the .NET debugger considers to be user code:
- DebuggerNonUserCodeAttribute tells the debugger that the code it's applied to isn't user code.
- DebuggerHiddenAttribute hides the code from the debugger, even if Just My Code is turned off.
- DebuggerStepThroughAttribute tells the debugger to step through the code it's applied to, rather than step into the code.
The .NET debugger considers all other code to be user code.
During .NET debugging:
- Debug > Step Into (or F11) on non-user code steps over the code to the next line of user code.
- Debug > Step Out (or Shift+F11) on non-user code runs to the next line of user code.
If there's no more user code, debugging continues until it ends, hits another breakpoint, or throws an error.
If the debugger breaks in non-user code (for example, you use Debug > Break All and pause in non-user code), the No Source window appears. You can then use a Debug > Step command to go to the next line of user code.
If an unhandled exception occurs in non-user code, the debugger breaks at the user code line where the exception was generated.
If first chance exceptions are enabled for the exception, the calling user-code line is highlighted in green in source code. The Call Stack window displays the annotated frame labeled [External Code].
C++ Just My Code
Starting in Visual Studio 2017 version 15.8, Just My Code for code stepping is also supported. This feature also requires use of the /JMC (Just my code debugging) compiler switch. The switch is enabled by default in C++ projects. For Call Stack window and call stack support in Just My Code, the /JMC switch isn't required.
To be classified as user code, the PDB for the binary containing the user code must be loaded by the debugger (use the Modules window to check loading status).
For call stack behavior, such as in the Call Stack window, Just My Code in C++ considers only these functions to be non-user code:
- Functions with stripped source information in their symbols file.
- Functions where the symbol files indicate that there's no source file corresponding to the stack frame.
- Functions specified in *.natjmc files in the %VsInstallDirectory%\Common7\Packages\Debugger\Visualizers folder.
For code stepping behavior, Just My Code in C++ considers only these functions to be non-user code:
- Functions for which the corresponding PDB file hasn't been loaded in the debugger.
- Functions specified in *.natjmc files in the %VsInstallDirectory%\Common7\Packages\Debugger\Visualizers folder.
Note
For code stepping support in Just My Code, C++ code must be compiled using the MSVC compilers in Visual Studio 15.8 Preview 3 or later, and the /JMC compiler switch must be enabled (it is enabled by default). For additional details, see Customize C++ call stack and code stepping behavior and this blog post. For code compiled using an older compiler, .natstepfilter files are the only way to customize code stepping, which is independent of Just My Code. See Customize C++ stepping behavior.
During C++ debugging, non-user code is skipped by default. During C++ debugging:
- Debug > Step Into (or F11) on non-user code steps over the code or runs to the next line of user code, if Step Into is called from non-user code.
- Debug > Step Out (or Shift+F11) on non-user code runs to the next line of user code (outside of the current stack frame).
If there's no more user code, debugging continues until it ends, hits another breakpoint, or throws an error.
If the debugger breaks in non-user code (for example, you use Debug > Break All and pause in non-user code), stepping continues in the non-user code.
If the debugger hits an exception, it stops on the exception, whether it is in user or non-user code. User-unhandled options in the Exception Settings dialog box are ignored.
Customize C++ call stack and code stepping behavior
For C++ projects, you can specify the modules, source files, and functions the Call Stack window treats as non-user code by specifying them in *.natjmc files. This customization also applies to code stepping if you're using the latest compiler (see C++ Just My Code).
- To specify non-user code for all users of the Visual Studio machine, add the .natjmc file to the %VsInstallDirectory%\Common7\Packages\Debugger\Visualizers folder.
- To specify non-user code for an individual user, add the .natjmc file to the %USERPROFILE%\My Documents\<Visual Studio version>\Visualizers folder.
A .natjmc file is an XML file with this syntax:
<?xml version="1.0" encoding="utf-8"?>
<NonUserCode xmlns="http://schemas.microsoft.com/vstudio/debugger/jmc/2015">

  <!-- Modules -->
  <Module Name="ModuleSpec" />
  <Module Name="ModuleSpec" Company="CompanyName" />

  <!-- Files -->
  <File Name="FileSpec"/>

  <!-- Functions -->
  <Function Name="FunctionSpec" />
  <Function Name="FunctionSpec" Module ="ModuleSpec" />
  <Function Name="FunctionSpec" Module ="ModuleSpec" ExceptionImplementation="true" />

</NonUserCode>
Module element attributes
| Attribute | Description |
|---|---|
Name |
Required. The full path of the module or modules. You can use the Windows wildcard characters ? (zero or one character) and * (zero or more characters). For example,<Module Name="?:\3rdParty\UtilLibs\*" />tells the debugger to treat all modules in \3rdParty\UtilLibs on any drive as external code. |
Company |
Optional. The name of the company that publishes the module that is embedded in the executable file. You can use this attribute to disambiguate the modules. |
File element attributes
| Attribute | Description |
|---|---|
Name |
Required. The full path of the source file or files to treat as external code. You can use the Windows wildcard characters ? and * when specifying the path. |
Function element attributes
| Attribute | Description |
|---|---|
Name |
Required. The fully qualified name of the function to treat as external code. ou can use the Windows wildcard characters ? and * when specifying the path. |
Module |
Optional. The name or full path to the module that contains the function. You can use this attribute to disambiguate functions with the same name. |
ExceptionImplementation |
When set to true, the call stack displays the function that threw the exception rather than this function. |
Customize C++ stepping behavior independent of Just My Code settings
In C++ projects, you can specify functions to step over by listing them as NoStepInto functions in *.natstepfilter files. Functions listed in *.natstepfilter files aren't dependent on Just My Code settings. A NoStepInto function tells the debugger to step over the function, even if it calls some StepInto functions or other user code. Unlike functions listed in .natjmc, the debugger will step into the first line of user code inside the NoStepInto function.
- To specify non-user code for all local Visual Studio users, add the .natstepfilter file to the %VsInstallDirectory%\Common7\Packages\Debugger\Visualizers folder.
- To specify non-user code for an individual user, add the .natstepfilter file to the %USERPROFILE%\My Documents\<Visual Studio version>\Visualizers folder.
Note
Some third-party extensions may disable .natstepfilter functionality.
A .natstepfilter file is an XML file with this syntax:
<?xml version="1.0" encoding="utf-8"?>
<StepFilter xmlns="http://schemas.microsoft.com/vstudio/debugger/natstepfilter/2010">
    <Function>
        <Name>FunctionSpec</Name>
        <Action>StepAction</Action>
    </Function>
    <Function>
        <Name>FunctionSpec</Name>
        <Module>ModuleSpec</Module>
        <Action>StepAction</Action>
    </Function>
</StepFilter>
| Element | Description |
|---|---|
Function |
Required. Specifies one or more functions as non-user functions. |
Name |
Required. An ECMA-262 formatted regular expression specifying the full function name to match. For example:<Name>MyNS::MyClass::.*</Name>tells the debugger that all methods in MyNS::MyClass are to be considered non-user code. The match is case-sensitive. |
Module |
Optional. An ECMA-262 formatted regular expression specifying the full path to the module containing the function. The match is case-insensitive. |
Action |
Required. One of these case-sensitive values:NoStepInto - tells the debugger to step over the function.StepInto - tells the debugger to step into the function, overriding any other NoStepInto for the matched function. |
Additional information on .natstepfilter and .natjmc files
Starting in Visual Studio 2022 version 17.6, you can add .natjmc and .natstepfilter files directly to the solution or project.
Syntax errors in .natstepfilter and .natjmc files aren't reported in the debugger's Output window.
Unlike .natvis files, .natstepfilter and .natjmc files aren't hot-reloaded. Instead, these files are reloaded near the beginning of the debug session.
For template functions, the use of
<.*>or<.*in the name may be helpful.
JavaScript Just My Code
For .esproj projects in Visual Studio 2022, Visual Studio Code uses a launch.json file to configure and customize the debugger. launch.json is a debugger configuration file.
Visual Studio attaches the debugger only to user code. For .esproj projects, you can configure user code (that is, Just My Code settings) in Visual Studio using the skipFiles setting in launch.json. This setting works the same as the launch.json settings in VS Code. For more information about skipFiles, see Skipping Uninteresting Code.