Get started debugging multithreaded applications (C#, Visual Basic, C++)
Visual Studio provides several tools and user interface elements to help you debug multithreaded applications. This tutorial shows how to use thread markers, the Parallel Stacks window, the Parallel Watch window, conditional breakpoints, and filter breakpoints. Completing this tutorial familiarizes you with Visual Studio features for debugging multithreaded applications.
These two articles provide additional information on using other multithreaded debugging tools:
To use the Debug Location toolbar and the Threads window, see Walkthrough: Debug a multithreaded application.
For a sample that uses Task (managed code) and the concurrency runtime (C++), see Walkthrough: Debug a parallel application. For general debugging tips that apply to most multithreaded application types, read both that article and this one.
The first step is to create a multithreaded application project.
Create a multithreaded app project
Open Visual Studio and create a new project.
If the start window isn't open, choose File > Start Window.
On the start window, choose Create a new project.
On the Create a new project window, enter or type console in the search box. Next, choose C#, C++, or Visual Basic from the Language list, and then choose Windows from the Platform list.
After you apply the language and platform filters, choose the Console App template for .NET or C++, and then choose Next.
Note
If you don't see the correct template, go to Tools > Get Tools and Features..., which opens the Visual Studio Installer. Choose the .NET desktop development or Desktop development with C++ workload, then choose Modify.
In the Configure your new project window, type or enter MyThreadWalkthroughApp in the Project name box. Then, choose either Next or Create, whichever option is available.
For a .NET Core or .NET 5+ project, choose either the recommended target framework or .NET 8, and then choose Create.
A new console project appears. After the project has been created, a source file appears. Depending on the language you have chosen, the source file might be called Program.cs, MyThreadWalkthroughApp.cpp, or Module1.vb.
Delete the code that appears in the source file and replace it with the following updated code. Choose the appropriate snippet for your code configuration.
using System; using System.Threading; public class ServerClass { static int count = 0; // The method that will be called when the thread is started. public void InstanceMethod() { Console.WriteLine( "ServerClass.InstanceMethod is running on another thread."); int data = count++; // Pause for a moment to provide a delay to make // threads more apparent. Thread.Sleep(3000); Console.WriteLine( "The instance method called by the worker thread has ended. " + data); } } public class Simple { public static void Main() { for (int i = 0; i < 10; i++) { CreateThreads(); } } public static void CreateThreads() { ServerClass serverObject = new ServerClass(); Thread InstanceCaller = new Thread(new ThreadStart(serverObject.InstanceMethod)); // Start the thread. InstanceCaller.Start(); Console.WriteLine("The Main() thread calls this after " + "starting the new InstanceCaller thread."); } }On the File menu, select Save All.
(Visual Basic only) In Solution Explorer (right pane), right-click the project node, choose Properties. Under the Application tab, change the Startup object to Simple.
Debug the multithreaded app
In the source code editor, look for the following code snippet:
Left-click in the left gutter of the
Thread.Sleepor, for C++,std::this_thread::sleep_forstatement to insert a new breakpoint.In the gutter, a red circle indicates that a breakpoint is set at this location.
On the Debug menu, select Start Debugging (F5).
Visual Studio builds the solution, the app starts to run with the debugger attached, and then the app stops at the breakpoint.
In the source code editor, locate the line that contains the breakpoint.
Discover the thread marker
In the Debug Toolbar, select the Show Threads in Source button
 .
.Press F11 twice to advance the debugger.
Look at the gutter on the left side of the window. On this line, notice a thread marker icon
 that resembles two twisted threads. The thread marker indicates that a thread is stopped at this location.
A thread marker can be partially concealed by a breakpoint.
Hover the pointer over the thread marker. A DataTip appears telling you the name and thread ID number for each stopped thread. In this case, the name is probably
<noname>.
Select the thread marker to see the available options on the shortcut menu.
View the thread locations
In the Parallel Stacks window, you can switch between a Threads view and (for task-based programming) Tasks view, and you can view call stack information for each thread. In this app, we can use the Threads view.
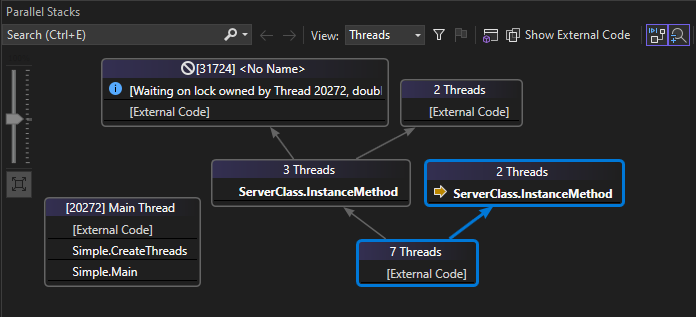
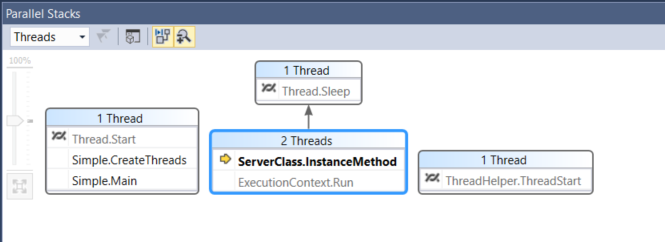
Open the Parallel Stacks window by choosing Debug > Windows > Parallel Stacks. You should see something similar to the following. The exact information can differ depending on the current location of each thread, your hardware, and your programming language.

In this example, from left to right we see this information for managed code:
- The current thread (yellow arrow) has entered
ServerClass.InstanceMethod. You can view the thread ID and stack frame of a thread by hovering overServerClass.InstanceMethod. - Thread 31724 is waiting on a lock owned by Thread 20272.
- The Main thread (left side) has stopped on [External Code], which you can view in detail if you choose Show External Code.

In this example, from left to right we see this information for managed code:
- The Main thread (left side) has stopped on
Thread.Start, where the stop point is identified by the thread marker icon .
. - Two threads have entered the
ServerClass.InstanceMethod, one of which is the current thread (yellow arrow), while the other thread has stopped inThread.Sleep. - A new thread (on the right) is also starting but is stopped on
ThreadHelper.ThreadStart.
- The current thread (yellow arrow) has entered
To view the threads in a list view, select Debug > Windows > Threads.

In this view, you can easily see that thread 20272 is the Main thread and is currently located in external code, specifically System.Console.dll.
Note
For more information on using the Threads window, see Walkthrough: Debug a Multithreaded Application.
Right-click entries in the Parallel Stacks or Threads window to see the available options on the shortcut menu.
You can take various actions from these right-click menus. For this tutorial, you explore more of these details in the Parallel Watch window (next sections).
Set a watch on a variable
Open the Parallel Watch window by selecting Debug > Windows > Parallel Watch > Parallel Watch 1.
Select the cell where you see the
<Add Watch>text (or the empty header cell in the fourth column) and enterdata.The values for the data variable for each thread appear in the window.
Select the cell where you see the
<Add Watch>text (or the empty header cell in the fifth column) and entercount.The values for the
countvariable for each thread appear in the window. If you don't see this much information yet, try pressing F11 a few times to advance the execution of the threads in the debugger.
Right-click on one of the rows in the window to see the available options.
Flag and unflag threads
You can flag threads to keep track of important threads and ignore the other threads.
In the Parallel Watch window, hold down the Shift key and select multiple rows.
Right-click and select Flag.
All the selected threads are flagged. Now, you can filter to show only flagged threads.
In the Parallel Watch window, select the Show Only Flagged Threads button
 .
.Only the flagged threads appear in the list.
Tip
After you have flagged some threads, you can right-click a line of code in the code editor and choose Run Flagged Threads to Cursor. Make sure to choose code that all flagged threads will reach. Visual Studio will pause threads on the selected line of code, making it easier to control the order of execution by freezing and thawing threads.
Select the Show Only Flagged Threads button again to toggle back to Show All Threads mode.
To unflag threads, right-click one or more flagged threads in the Parallel Watch window and select Unflag.
Freeze and thaw thread execution
Tip
You can freeze and thaw (suspend and resume) threads to control the order in which threads perform work. This can help you resolve concurrency issues such as deadlocks and race conditions.
In the Parallel Watch window, with all the rows selected, right-click and select Freeze.
In the second column, a pause icon appears for each row. The pause icon indicates that the thread is frozen.
Deselect all other rows by selecting one row only.
Right-click a row and select Thaw.
The pause icon goes away on this row, which indicates the thread is no longer frozen.
Switch to the code editor and press F11. Only the unfrozen thread runs.
The app might also instantiate some new threads. Any new threads are unflagged and aren't frozen.
Follow a single thread with conditional breakpoints
It can be helpful to follow the execution of a single thread in the debugger. One way to do that is by freezing threads that you aren't interested in. In some scenarios, you might need to follow a single thread without freezing other threads, for example to reproduce a particular bug. To follow a thread without freezing other threads, you must avoid breaking into code except on the thread that you're interested in. You can do this task by setting a conditional breakpoint.
You can set breakpoints on different conditions, such as the thread name or the thread ID. It can be helpful to set the condition on data that you know is unique to each thread. This approach is common during debugging when you're more interested in some particular data value than in any particular thread.
Right-click the breakpoint you previously created and select Conditions.
In the Breakpoint Settings window, enter
data == 5for the conditional expression.
Tip
If you are more interested in a specific thread, then use a thread name or thread ID for the condition. To do this in the Breakpoint Settings window, select Filter instead of Conditional expression, and follow the filter tips. You might want to name your threads in your app code, as threads IDs change when you restart the debugger.
Close the Breakpoint Settings window.
Select the Restart
 button to restart your debugging session.
You break into code on the thread where the data variable's value is 5. In the Parallel Watch window, look for the yellow arrow indicating the current debugger context.
Now, you can step over code (F10) and step into code (F11) and follow the execution of the single thread.
So long as the breakpoint condition is unique to the thread, and the debugger doesn't hit any other breakpoints on other threads (you might need to disable them), you can step over code and step into code without switching to other threads.
Note
When you advance the debugger, all threads will run. However, the debugger won't break into code on other threads unless one of the other threads hits a breakpoint.