Troubleshoot SNAT port exhaustion on Azure Kubernetes Service nodes
This article helps you find and troubleshoot Azure Kubernetes Service (AKS) nodes that experience Source Network Address Translation (SNAT) port exhaustion.
Note
- To troubleshoot SNAT port exhaustion on AKS nodes in an AKS cluster running Kubernetes jobs, perform the following steps only when the jobs are actively running on the AKS nodes.
- To learn more about SNAT ports and their allocation per virtual machine, see What SNAT ports are.
Step 1: Locate the node that experiences SNAT port exhaustion
Get the IP address of the AKS node that experiences active SNAT port exhaustion from the Azure portal.
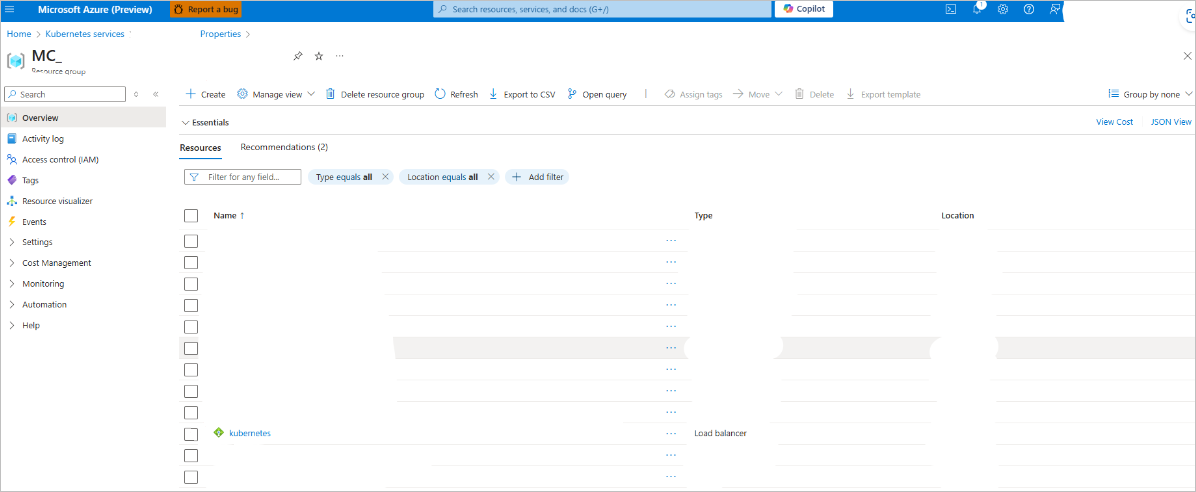
Locate the default Kubernetes load balancer by navigating to your AKS cluster's resource group.
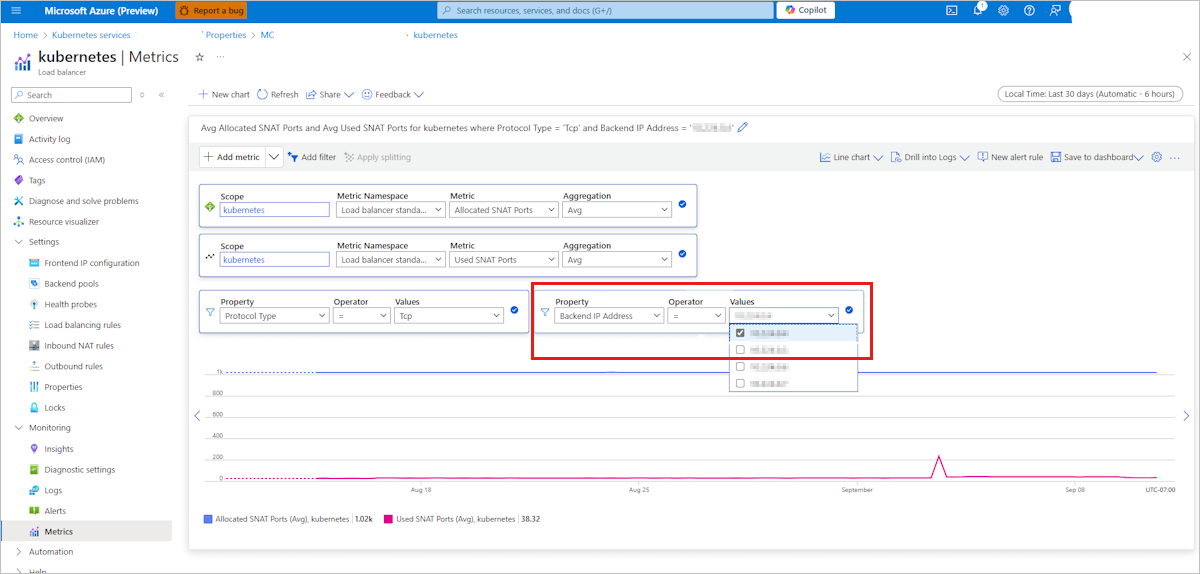
Locate the AKS node that's experiencing SNAT port exhaustion by checking SNAT port usage and allocation on the load balancer metrics page. The Values drop-down list shows node IP addresses.
Connect to your AKS cluster and use the node IP address to get the node name by running the following
kubectlcommand:kubectl get nodes -o wide | grep <node IP>
Step 2: Locate the Linux pod that has high outbound connections
Note
- Tcptracer is one of the BPF Compiler Collection (BCC) tools that are pre-installed on Linux nodes. It allows you to trace TCP established connections (
connect(),accept(), andclose()). You can use it to find high outbound connections from the source IP address and network namespace (netns) of a pod. - To access the BCC tools, use kubectl node-shell only.
- All the following commands in this section are run as the root user on a Linux node that has the BCC tools installed.
On the Linux node that experiences SNAT port exhaustion, install kubectl node-shell:
curl -LO https://github.com/kvaps/kubectl-node-shell/raw/master/kubectl-node_shell
chmod +x ./kubectl-node_shell
sudo mv ./kubectl-node_shell /usr/local/bin/kubectl-node_shell
Use SSH to connect to the node that experiences SNAT port exhaustion and use
tcptracerto trace TCP established connections:kubectl node-shell <node name> cd /usr/share/bcc/tools /usr/share/bcc/tools# python3 tcptracer -t4vHere's a command output example:
Tracing TCP established connections. Ctrl-C to end.
TIME(ns)     TYPE         PID   COMM             IP SADDR            DADDR            SPORT  DPORT  NETNS
0           connect      18627  curl             4  1.2.3.4           5.6.7.8          53746  80     4026532785
3xxx9       close        18627  curl             4  1.2.3.4           5.6.7.8          53746  80     4026532785
1xxxx4      connect      18629  curl             4  1.2.3.4           9.10.11.12       35686  80     4026532785
2xxxx9      close        18629  curl             4  1.2.3.4           9.10.11.12       35686  80     4026532785
4xxxx5      connect      18631  curl             4  1.2.3.4           9.10.11.12       35688  80     4026532785
4xxxx8      close        18631  curl             4  1.2.3.4           9.10.11.12       35688  80     4026532785
7xxxx3      connect      18633  curl             4  1.2.3.4           13.14.15.16      35690  80     4026532785
9xxxx7      close        18633  curl             4  1.2.3.4           13.14.15.16      35690  80     4026532785
Write the previous command output to a log file, and then sort the output to review a list of high connections:
python3 tcptracer -t4v > log
head -n +2 log | tail -n 1 | awk '{print "Count",$6,$10}'; awk '{print $6,$10}' log | sort | uniq -c | sort -nrk 1 | column -t
Here's a command output example:
Count SADDR        NETNS
387   1.2.3.4      4026532785
8     11.22.33.44  4026532184
8     55.66.77.88  4026531992
Map the IP address with the most connections from the previous output to a pod. If it doesn't work, you can continue.
Note the
SADDRorNETNSvalue with the most connections from the previous output, and then run the following lsns command to map it to a PID. Lsns is a Linux tool that lists namespaces and maps namespaces to PIDs in the Linux process tree.lsns -t netHere's a command output example:
NS         TYPE NPROCS PID   USER  COMMAND
4026532785 net  3      19832 root  bash
Map the previous PID to a containerd process by using pstree. Pstree is a Linux tool that lists processes in a tree format for readability.
pstree -aps 19832Here's a command output example:
systemd,1
  `-containerd-shim,20946 -namespace k8s.io -id 2xxxf...
Note the first five characters of the containerd
-idin the command output. It will be used in step 7.Map the previous containerd
-idvalue to a POD ID by using crictl. Crictl provides a CLI for CRI-compatible container runtimes.crictl ps -aHere's a command output example:
CONTAINER   IMAGE     CREATED      STATE     NAME    ATTEMPT    POD ID        POD
6b5xxxxb    fbxxxxx1  6 hours ago  Running   ubuntu  0          2xxxxxxxxf    nginx
Use the first five characters of the previous containerd
-idvalue to match a POD ID.Get all pods running on the node and use the previous POD ID to match the pod that has high outbound connections from the command output:
kubectl get pods --all-namespaces -o wide --field-selector spec.nodeName=<nodename>
Step 3: Find all outbound network connections made by the application
Execute into the pod that's identified as having high outbound connections in Step 2 by using one of the following commands:
-
kubectl exec -it <pod name> -n <namespace> /bin/bash -
kubectl exec -it <pod name> -n <namespace> /bin/sh
-
Install the netstat command-line tool in the pod by running the following command. Netstat is a network troubleshooting tool for admins only.
On Debian, Ubuntu, or Linux Mint
apt update
apt install net-tools
On RHEL, CentOS, Fedora, AlmaLinux, or Rocky Linux
yum update
yum install net-tools
On Gentoo Linux
emerge -a sys-apps/net-toolsOn Alpine Linux
apk add net-toolsOn Arch Linux
pacman -S net-toolsOn OpenSUSE
zypper install net-tools
Once netstat is installed in the pod, run the following command:
netstat -ptn | grep -i establishedHere's a command output example:
tcp 0 0 10.x.x.x:xxxx 20.x.x.x:443 ESTABLISHED xxxxx3/telnet
In the command output, the local address is the pod's IP address, and the foreign address is the IP to which the application connects. The public IP connections in the ESTABLISHED state are the connections that utilize SNAT. Ensure that you count only the connections in the ESTABLISHED state to public IP addresses and ignore any connections in the ESTABLISHED state to private IP addresses.
Repeat the steps in this section for all other pods running on the node. The pod that has the most connections in the ESTABLISHED state to public IP addresses hosts the application that causes SNAT port exhaustion on the node. Work with your application developers to tune the application for improved network performance using the recommendations mentioned in Design connection-efficient applications. After implementing the recommendations, verify that you see less SNAT port exhaustion.
Contact us for help
If you have questions or need help, create a support request, or ask Azure community support. You can also submit product feedback to Azure feedback community.

