Troubleshoot memory saturation in AKS clusters
This article discusses methods for troubleshooting memory saturation issues. Memory saturation occurs if at least one application or process needs more memory than a container host can provide, or if the host exhausts its available memory.
Prerequisites
- The Kubernetes kubectl command-line tool. To install kubectl by using Azure CLI, run the az aks install-cli command.
Symptoms
The following table outlines the common symptoms of memory saturation.
| Symptom | Description |
|---|---|
| Unschedulable pods | Additional pods can't be scheduled if the node is close to its set memory limit. |
| Pod eviction | If a node is running out of memory, the kubelet can evict pods. Although the control plane tries to reschedule the evicted pods on other nodes that have resources, there's no guarantee that other nodes have sufficient memory to run these pods. |
| Node not ready | Memory saturation can cause kubelet and containerd to become unresponsive, eventually causing node readiness issues. |
| Out-of-memory (OOM) kill | An OOM problem occurs if the pod eviction can't prevent a node issue. |
Troubleshooting checklist
To reduce memory saturation, use effective monitoring tools and apply best practices.
Step 1: Identify nodes that have memory saturation
Use either of the following methods to identify nodes that have memory saturation:
In a web browser, use the Container Insights feature of AKS in the Azure portal.
In a console, use the Kubernetes command-line tool (kubectl).
Container Insights is a feature within AKS that monitors container workload performance. For more information, see Enable Container insights for Azure Kubernetes Service (AKS) cluster.
On the Azure portal, search for and select Kubernetes services.
In the list of Kubernetes services, select the name of your cluster.
In the navigation pane of your cluster, find the Monitoring heading, and then select Insights.
Set the appropriate Time Range value.
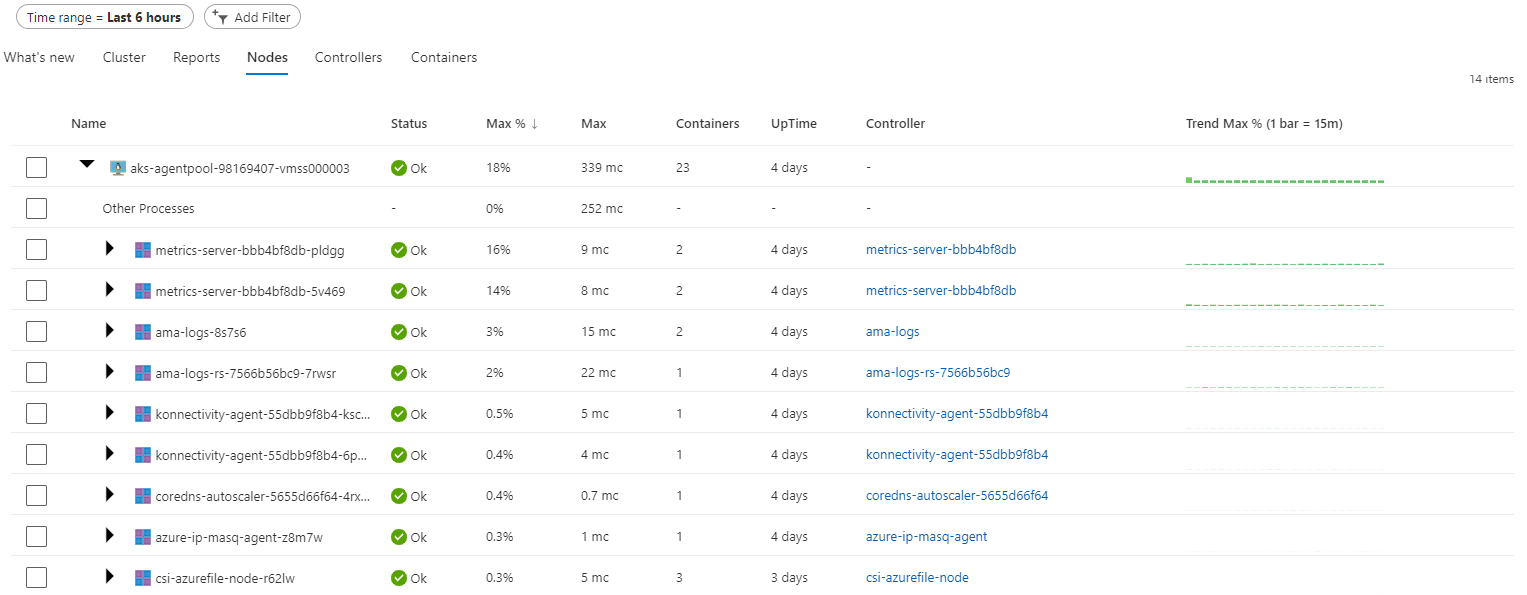
Select the Nodes tab.
In the Metric list, select Memory working set (computed from Allocatable).
In the percentiles selector, set the sample to Max, and then select the Max % column label two times. This action sorts the table nodes by the maximum percentage of memory used, from highest to lowest.
Because the first node has the highest memory usage, select that node to investigate the memory usage of the pods that are running on the node.
Note
The percentage of CPU or memory usage for pods is based on the CPU request specified for the container. It doesn't represent the percentage of the CPU or memory usage for the node. So, look at the actual CPU or memory usage rather than the percentage of CPU or memory usage for pods.
Now that you've identified the pods that are using high memory, you can identify the applications that are running on the pod.
Step 2: Review best practices to avoid memory saturation
Review the following table to learn how to implement best practices for avoiding memory saturation.
| Best practice | Description |
|---|---|
| Use memory requests and limits | Kubernetes provides options to specify the minimum memory size (request) and the maximum memory size (limit) for a container. By configuring limits on pods, you can avoid memory pressure on the node. Make sure that the aggregate limits for all pods that are running doesn't exceed the node's available memory. This situation is called overcommitting. The Kubernetes scheduler allocates resources based on set requests and limits through Quality of Service (QoS). Without appropriate limits, the scheduler might schedule too many pods on a single node. This might eventually bring down the node. Additionally, while the kubelet is evicting pods, it prioritizes pods in which the memory usage exceeds their defined requests. We recommend that you set the memory request close to the actual usage. |
| Enable the horizontal pod autoscaler | By scaling the cluster, you can balance the requests across many pods to prevent memory saturation. This technique can reduce the memory footprint on the specific node. |
| Use anti-affinity tags | For scenarios in which memory is unbounded by design, you can use node selectors and affinity or anti-affinity tags, which can isolate the workload to specific nodes. By using anti-affinity tags, you can prevent other workloads from scheduling pods on these nodes. This reduces the memory saturation problem. |
| Choose higher SKU VMs | Virtual machines (VMs) that have more random-access memory (RAM) are better suited to handle high memory usage. To use this option, you must create a new node pool, cordon the nodes (make them unschedulable), and drain the existing node pool. |
| Isolate system and user workloads | We recommend that you run your applications on a user node pool. This configuration makes sure that you can isolate the Kubernetes-specific pods to the system node pool and maintain the cluster performance. |
More information
Learn more about Azure Kubernetes Service (AKS) best practices
Monitor your Kubernetes cluster performance with Container insights
Third-party information disclaimer
The third-party products that this article discusses are manufactured by companies that are independent of Microsoft. Microsoft makes no warranty, implied or otherwise, about the performance or reliability of these products.
Third-party contact disclaimer
Microsoft provides third-party contact information to help you find additional information about this topic. This contact information may change without notice. Microsoft does not guarantee the accuracy of third-party contact information.
Contact us for help
If you have questions or need help, create a support request, or ask Azure community support. You can also submit product feedback to Azure feedback community.

