Demand planning process
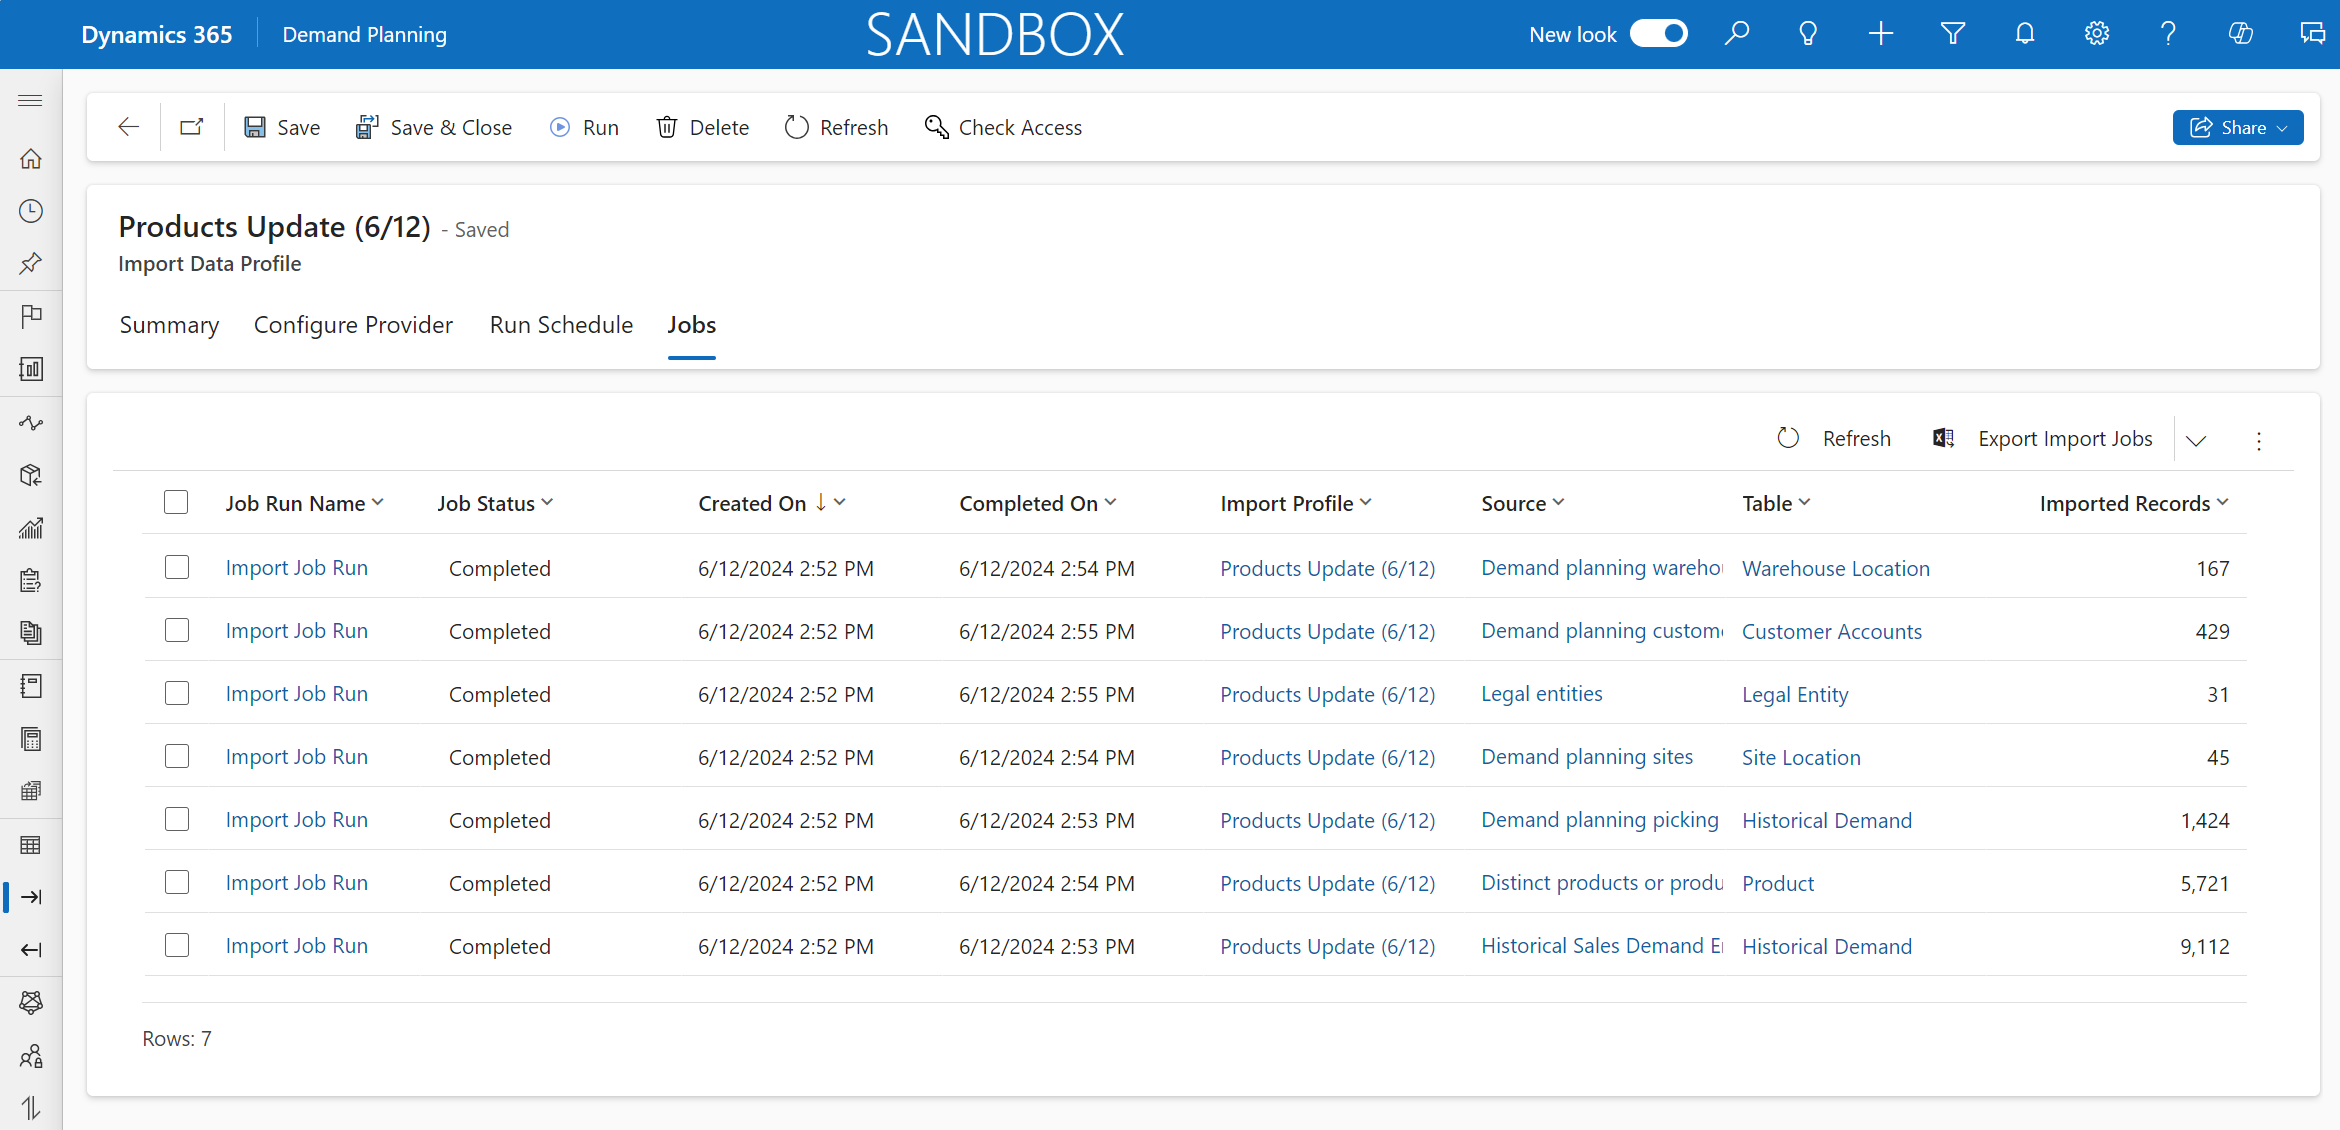
Your organization can import data into Demand Planning to use in forecasting and analysis. You can use data inputs from Microsoft Excel, Microsoft Azure, Microsoft Azure Data Lake, Supply Chain Management, and other systems to import data to Demand Planning. This approach allows for seamless integration of data for forecasting purposes. You can review data mapping for any entity and add custom fields. Additionally, you can monitor the import status and access outcomes through the import data profile.
As a planner, you need to create forecasts for upcoming years. In Demand Planning, you can use data from last year and shift it to next year to use as a basis, which is an example of creating a transformation. Your organization can create transformations to convert imported data into time series by identifying relevant columns, selecting time intervals, and adjusting dates as needed.
Your organization can create forecasts with different data sources and set forecast values that are daily, weekly, or monthly. You can also specify the length of time that you want the forecast for. Tabs in the upper part of the page in Demand Planning group together the different information and elements of your forecast model. Different forecasting models are available, such as AutoRegressive Integrated Moving Average (ARIMA) and error, trend, and seasonality (ETS). You can view the previous forecasts that ran along with the output time series. You can create forecasts that use an existing time series or you can create a new one.
After you run the forecast, you can export it to external systems that consume forecasts.
