Creating a service level dashboard
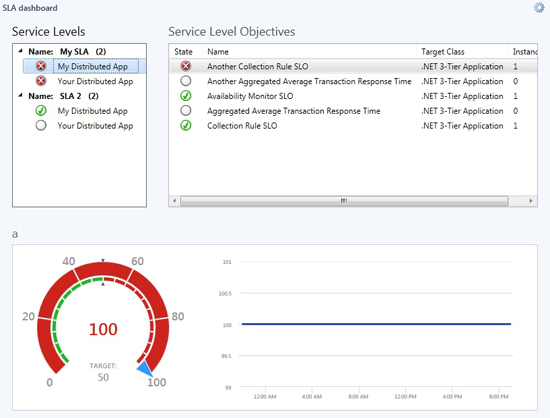
After you configure a service level objective, you can create a service level dashboard view to monitor the service level objective. The service level dashboard view displays a grid of service levels and a grid of service level objectives grid, which lists the various objectives that have a goal or target value and whether success is either above or below that target value for the currently selected SLA/instance. When you select an objective in the Service Level Objectives grid, a gauge and chart is displayed, as shown in the following image.

The gauge will show the average actual value, along with the target value and an indication as to whether the value and goal relationship corresponds to success (green) or failure (red). The chart will show a time history of the actual values, which will be a function of the aggregation of the values in the data warehouse, which will depend on the timeframe of the configured dashboard, as to whether the values come from the Hourly or Daily aggregation table.
To create a service level dashboard view
In the Operations console, select My Workspace.
Right-click the folder where you want to store the view, point to New, and select Dashboard View.
In the New Instance Wizard, on the Template page, select either Flow Layout or Grid Layout, and select Next.
On the General Properties page, enter a name for the dashboard view. The description is optional. Select Next.
On the Specify the Scope page, select Add.
In the Add SLA window, select the service level objective that you created, select Add, and select OK. You can add multiple service level objectives.
On the Specify the Scope page, in the Last section, set the period of time that you want to display in the dashboard view, and select Next.
Review the settings on the Summary page, and select Create.
Select Close.
Next steps
Learn how to create a service level objective to measure service availability of an application or a set of grouped computers for your service level dashboard by reviewing Monitoring Service Level Objectives by Using Operations Manager.
To view the service level objective over time to verify the organization is delivering against availability targets defined in your SLAs, see Running a Service Level Tracking Report.