Use the SSMS XEvent Profiler
Applies to:
SQL Server
Azure SQL Managed Instance
The XEvent Profiler is a SQL Server Management Studio (SSMS) feature that displays a live viewer window of Extended Events. This overview describes the reasons for using this profiler, key features, and instructions to get started viewing Extended Events.
Why would I use the XEvent Profiler?
Unlike SQL Profiler, XEvent profiler is directly integrated into SSMS and is built on top of the scalable Extended Events technology in the SQL engine. This feature enables quick access to a live streaming view of diagnostics events on the SQL Server. This view can be customized and those customizations can be shared with other SSMS users as a .viewsettings file. The session created by XE Profiler is less intrusive to the running SQL Server than a similar SQL trace would be when using SQL Profiler. This session can be customized by the user as well, using the existing XE session properties UI or by Transact-SQL.
Prerequisites
This feature is only available on SQL Server Management Studio (SSMS) v17.3 or later. Make sure you are using the latest version. You can find the latest version here.
Getting Started
To access the XEvent Profiler, follow these steps:
Open SQL Server Management Studio.
Connect to an instance of the SQL Server Database Engine or localhost.
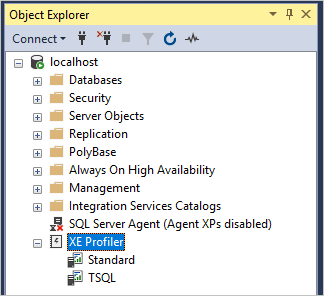
In Object Explorer, find the XE Profiler menu item and expand it by clicking the '+' sign.

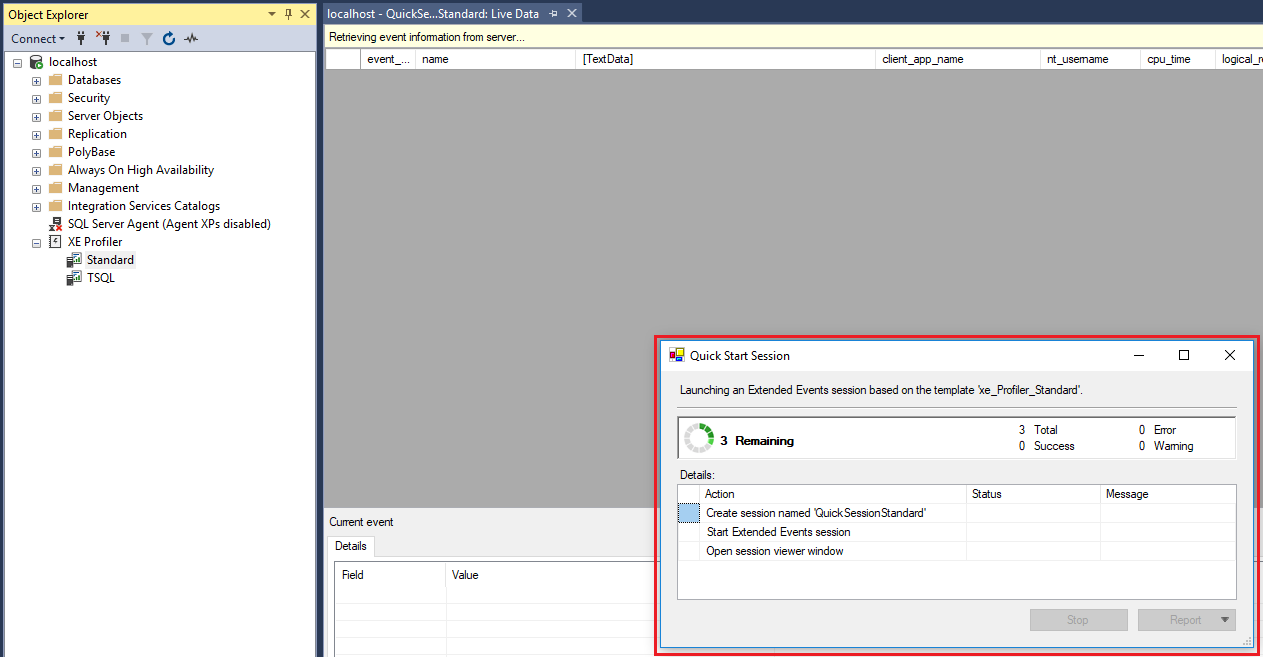
Double-click Standard if you want to view all events in this session. Click T-SQL if you want to view the logged SQL statements. If a session is not already created, a session is created for you.

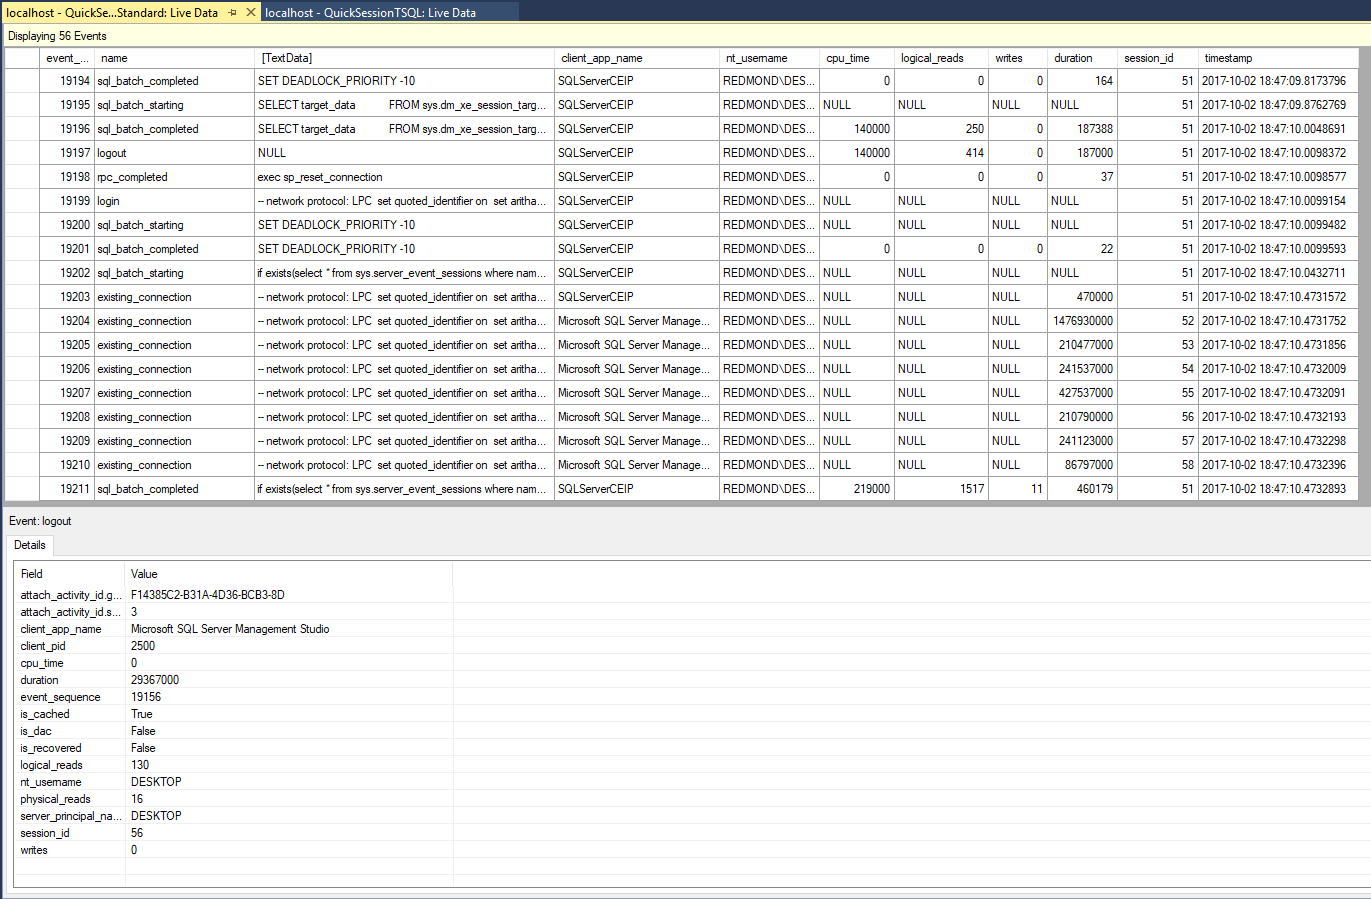
You can now view events captured by the session.
