Monitor with System Center Operations Manager - Analytics Platform System
Use System Center Operations Manager (SCOM) to monitor the Analytics Platform System (APS) appliance.
Before You Begin
Prerequisites
System Center Operations Manager 2007 R2, 2012, or 2012 SP1 must be installed and running.
SQL Server 2008 R2 Native Client or SQL Server 2012 Native Client must be installed.
The management packs to monitor SQL Server PDW must be installed, imported, and configured. Use the following articles for instructions to perform these tasks.
Monitor SQL Server PDW with Operations Manager
After configuring the Operations Manager Management Packs, select the Monitoring Pane of Operations Manager and drill down to SQL Server Appliance and then Microsoft SQL Server Parallel Data Warehouse. Underneath Microsoft SQL Server Parallel Data Warehouse, there are four choices: Alerts, Appliances, Appliance Diagram, and Nodes.
Alerts
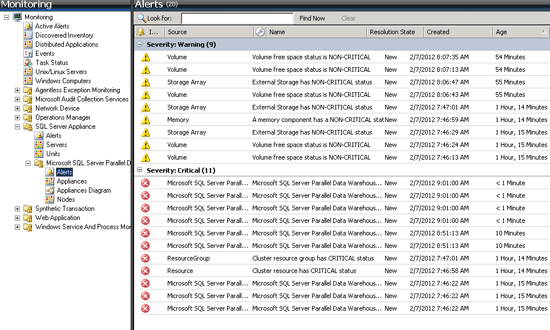
Alerts are where you can find the current alerts to manage.

Appliances
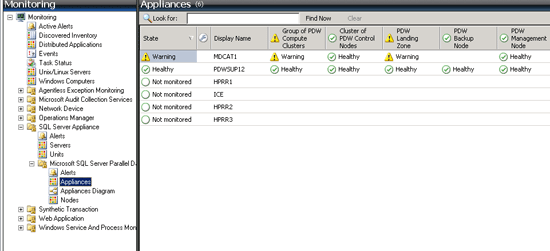
The Appliances page is where you find the currently discovered and monitored SQL Server PDW Appliances in your environment. If an appliance doesn't show up here and you have created the ODBC connection for it, then there might be something wrong with your PDWWatcher account. If they show up as "Not monitored", there might be something wrong with your PDWMonitor account. Be patient since Operations Manager doesn't make changes in real time, but periodically checks for new appliances to monitor and periodically sends queries to appliances for monitoring.

Appliances Diagram
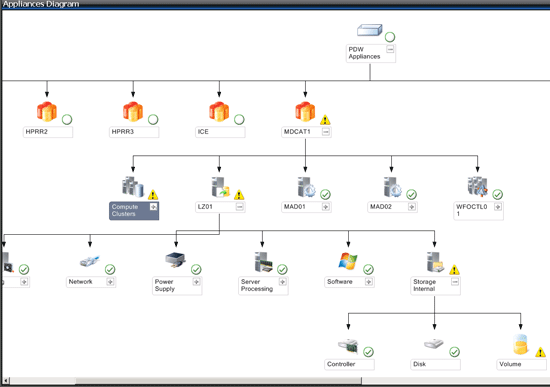
The Appliances Diagram Page is where you can get a look at the health of your appliance with a tree view:

Nodes
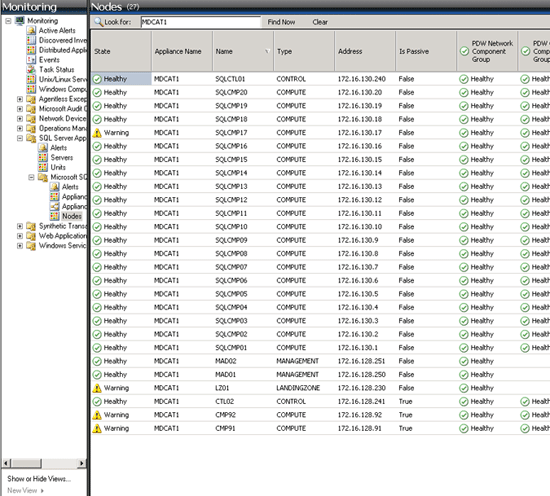
Finally, the Nodes view allows you to see the health of your appliance through each node:
