Customers dashboard in commercial marketplace analytics
This article provides information on the Customers dashboard in Partner Center. This dashboard displays information about your customers, including growth trends, presented in a graphical and downloadable format.
Note
For detailed definitions of analytics terminology, see Commercial marketplace analytics terminology and common questions.
Customers dashboard
The Customers dashboard displays data for customers who acquire your offers. You can view graphical representations of the following items:
- Active and churned customers' trend
- Customer growth trend including existing, new, and churned customers
- Customers by orders and usage
- Customers percentile
- Customer type by orders and usage
- Customers by geography
- Customers details table
- Customers page filters
Note
The maximum latency between customer acquisition and reporting in Partner Center is 48 hours.
Customer page dashboard filters
These filters are applied at the Customers page level. Select multiple filters to render the chart for what you want to see in the Detailed orders data export. Filters are applied on the data extracted for the month range you selected on the upper-right corner of the page.
The page has dashboard-level filters:
- Sales Channel
- Marketplace Subscription ID
- Customer ID
- Customer Name
- Customer Company Name
- Country/region
Each filter is expandable with multiple options that you can select. Filter options are dynamic and based on the selected date range.
Active and churned customers' trend
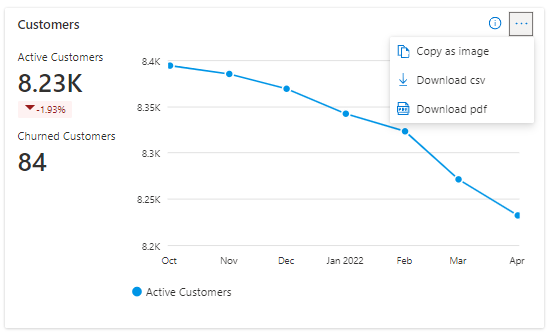
This widget shows your active and churned customer trend for the selected computation period. Line chart represents the trend and you can view the value for each month by hovering over the line. The percentage value below Active customers in the widget represents the amount of growth during the selected computation period. For example, the following Screenshot showing a decline of 1.93% in active customers for the selected computation period.
There are three customer types: new, existing, and churned.
- A new customer who acquires one or more of your offers for the first time within the selected month.
- An existing customer who acquires one or more of your offers prior to the month selected.
- A churned customer who cancels all offers previously purchased. Churned customers for VM offers are calculated as customers who didn't show any VM usage for two days or more. Churned customers are represented in the negative axis in the Trend widget.
Select the ellipsis (...) to copy the widget image, download aggregated widget data as a .csv file, or download the image as a PDF.
Customer growth trend including existing, new, and churned customers
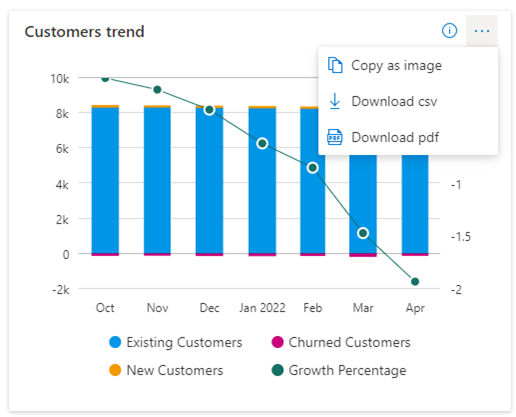
This widget shows trend and count of all customers, including new, existing, and churned, with a month-by-month growth trend.
- The line chart represents the overall customer growth percentages.
- The month column represents the count of customers stacked by new, existing, and churned customers.
- The churned customer count is displayed on the negative direction of the X-Axis.
- You can select specific legend items to display more detailed views. For example, select new customers from the legend to display only new customers.
- Hovering over a column in the chart displays details for that month only.
Select the ellipsis (...) to copy the widget image, download aggregated widget data as .csv file, or download the image as a PDF.
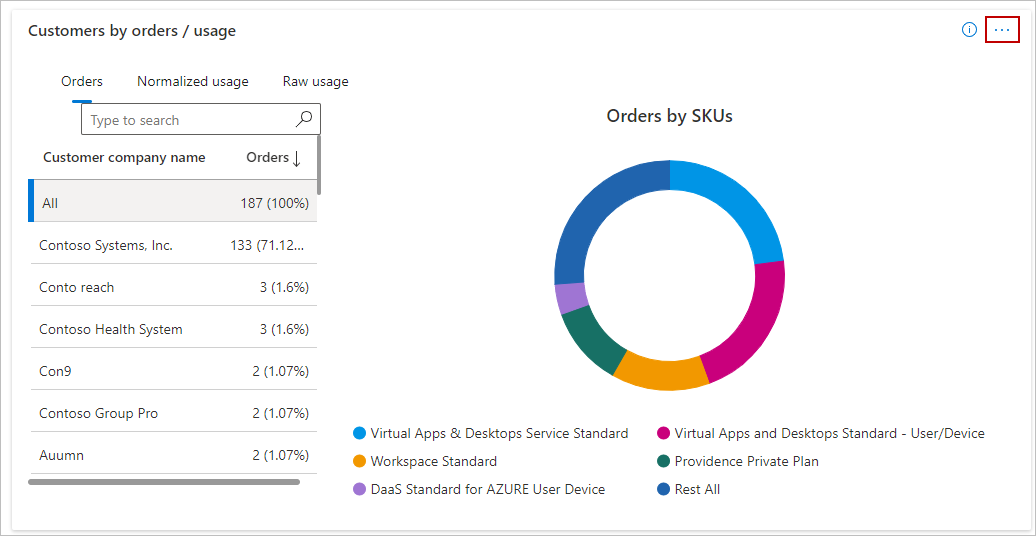
Orders by customers type
This chart has tabs for Orders, Normalized usage, and Raw usage. Select Orders to show order details.
- The Leader board presents details of the customers ranked by order count. After you select a customer, the customer details are presented in the adjoining "Details", "Orders by SKUs" and "SKUs by Seats" sections.
- The Customer profile details are displayed in this space when publishers are signed in with an owner role. If publishers are signed in with a contributor role, the details in this section aren't available.
- The Orders by SKUs donut chart displays the breakdown of orders purchased for plans. The top five plans with the highest order count are displayed, while the rest of the orders are grouped under Rest all.
- The SKUs by Seats donut chart displays the breakdown of seats ordered for plans. The top five plans with the highest seats are displayed, while the rest of the orders are grouped under Rest All.
Select Normalized usage or Raw usage for those views.
- The Leader board presents details of the customers ranked by usage hours count. After you select a customer, the details of the customer are presented in the adjoining "Details", "Normalized Usage by offers" and "Normalized Usage by virtual machine (VM) Size(s)" section.
- The Customer profile details are displayed in this space when publishers are logged in with an owner role. If publishers are logged in with a contributor role, the details in this section aren't available.
- The Normalized usage by Offers donut chart displays the breakdown of usage consumed by the offers. The top five plans with the highest usage count are displayed, while the rest of the offers are grouped under Rest All.
- The Normalized usage by VM Size(s) donut chart displays the breakdown of usage consumed by different VM Sizes. The top five VM Sizes with the highest normalized usage are displayed, while the rest of the usage is grouped under Rest All.
Select the ellipsis (...) to copy the widget image, download aggregated widget data as .csv file, or download the image as a PDF.
Top customers percentile
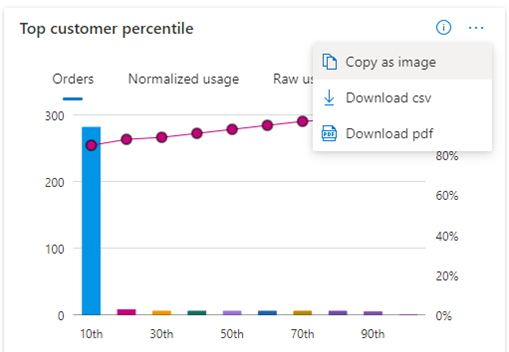
The Top customers percentile chart has three tabs, "Orders," "Normalized usage," and "Raw usage." The top customer percentile is displayed along the x-axis, as determined by the number of orders. The y-axis displays the customer's order count. The secondary y-axis (line graph) displays the cumulative percentage of the total number of orders. You can display details by hovering over points along the line chart.
Select the ellipsis (...) to copy the widget image, download aggregated widget data as .csv file, or download the image as a PDF.
Customer type by orders and usage
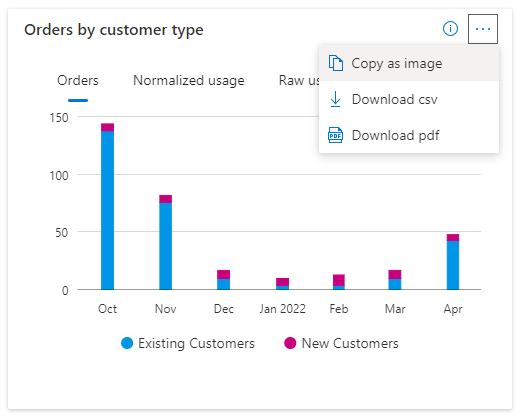
The Orders/usage by customer type chart displays the number of orders, normalized usage, and raw usage hours split between new customers and existing customers; based on the selection of orders, normalized, and raw usage respectively in the chart.
This chart shows the following:
- A new customer who acquires one or more of your offers or reported usage for the first time within the same calendar month (y-axis).
- An existing customer who previously acquired an offer from you or reported usage prior to the calendar month reported (on the y-axis).
Select the ellipsis (...) to copy the widget image, download aggregated widget data as .csv file, or download the image as a PDF.
Customers by geography
For the selected computation period, the table displays the total number of customers against geography dimension.
Select the ellipsis (...) to copy the widget image, download aggregated widget data as .csv file, or download the image as a PDF.
Customer details table
Important
To download the data in CSV, you can use the Download data option, available at the top of the page.
The Customer details table displays a numbered list of the top 1,000 customers sorted by the date they first acquired one of your offers. You can expand a section by selecting the expansion icon in the details ribbon.
- Customer personal information is only available if the customer provides consent. You can only view this information if you're signed in with an owner role level of permissions.
- Each column in the grid is sortable.
- Apply filters to the table to display only the data you're interested in. Filter data by Company name, Customer ID, Marketplace Subscription ID, Azure License Type, Date Acquired, Date Lost, Customer Email, Customer Country/Region/State/City/Zip, Customer Language, and so on.
- When an offer is purchased by a protected customer, information in Customer Detailed Data is masked (************).
- Customer dimension details such as Company Name, Customer Name, and Customer Email are at an organization ID level, not at Azure Marketplace or the Microsoft commercial marketplace transaction level.
Select the ellipsis (...) to copy the widget image, or download the image as a PDF.
Customer data dictionary
| Column name | Definition |
|---|---|
| MarketplaceSubscriptionId | The unique identifier associated with the Azure subscription the customer used to purchase your commercial marketplace offer. For infrastructure offers, this is the customer's Azure subscription GUID. For SaaS offers, this is shown as zeros since SaaS purchases don't require an Azure subscription. |
| DateAcquired | Date when the customer first purchased any offer you published. |
| DateLost | Date when the customer canceled the last of all previously purchased offers. |
| IsActive | Flag to indicate if the customer is active or not. |
| ProviderName | The name of the provider involved in the relationship between Microsoft and the customer. If the customer is an Enterprise through Reseller, this is the reseller. If a Cloud Solution Provider (CSP) is involved, this is the CSP. |
| ProviderEmail | Email address of the provider involved in the relationship between Microsoft and the customer. If the customer is an Enterprise through Reseller, this is the reseller. If a Cloud Solution Provider (CSP) is involved, this is the CSP. |
| FirstName | First name provided by the customer. Name could be different than the name provided in a customer's Azure subscription. |
| LastName | Last name provided by the customer. Name could be different than the name provided in a customer's Azure subscription. |
| The e-mail address provided by the end customer. Email could be different than the e-mail address in customer's Azure subscription. | |
| CustomerCompanyName | Company name provided by the customer. It could be different than the company name in customer's Azure subscription. |
| CustomerCity | City name provided by the customer. City could be different than the city in a customer's Azure subscription. |
| CustomerPostalCode | Postal code provided by the customer. It could be different than the postal code provided in customer's Azure subscription. |
| CustomerCommunicationCulture | Preferred communication language by the customer. |
| CustomerCountryRegion | The country/region name provided by the customer. It could be different than the country/region in customer's Azure subscription. |
| AzureLicenseType | The type of licensing agreement used by customers to purchase Azure. Also known as the channel. The possible values are: - Cloud Solution Provider - Enterprise - Enterprise through Reseller - Pay as You Go |
| PromotionalCustomers | The value lets you know if the customer proactively opted in for promotional contact from publishers. At this time, we aren't presenting the option to customers, so we indicate "No" across the board. After this feature is deployed, we'll start updating accordingly. |
| CustomerState | State of residence provided by the customer. It could be different than the state provided in customer's Azure subscription. |
| CommerceRootCustomer | One Billing Account ID can be associated with multiple Customer IDs. One combination of a Billing Account ID and a Customer ID can be associated with multiple commercial marketplace subscriptions. The Commerce Root Customer signifies the name of the subscription's customer. |
| CustomerId | The unique identifier assigned to a customer. A customer can have zero or more Azure Marketplace subscriptions. |
| BillingAccountId | The identifier of the account on which billing is generated. Map BillingAccountId to CustomerId to connect your Payout Transaction Report with the Customer, Order, and Usage Reports. |
| CustomerType | The value of this field signifies the type of the customer. The possible values are: - individual - organization |
| OfferId | Marketplace offer ID associated with the transaction. |
| OfferName | Name of the commercial marketplace offer. |
| PrivateOfferId | The ID to identify a private marketplace offer. |
| PrivateOfferName | The name provided during private offer creation. |
| PlanId | Plan display name associated with the offer. It was originally a number. |
| IsPrivatePlan | Flag to identify if it's a private plan. - 0 indicates false - 1 indicates true |
| SKU | Plan associated with the offer. |
| BillingId | The Billing ID of the enterprise customer. |
| PurchaserEmail | Email of the entity purchasing or provisioning an offer. This could be same or different than the email of "bill-to" entity. |
| AddressLine1 | The Address Line 1 section of customer's street address. |
| ReferenceId | A unique identifier to indicate provisioned instances or purchased offers by the customer. This key can be used to link with Orders and Usage report. |
| lastModifiedAt | The latest timestamp for customer purchases. Use this field, via programmatic API access, to pull the latest snapshot of all customer purchase transactions since a specific date. |
| OfferType | The type of commercial marketplace offering like VM, SaaS, Azure apps etc. |
| MultiParty | Flag indicating whether a private offer transaction involved multiple parties. -1 indicates that ISV and channel partner were involved. -0 indicates only ISV partner was involved. |
| PartnerInfo | Represents SellerID and name of the partners involved in a Multiparty private offer transaction. |
| SalesNotes | Sales note added by ISV or Channel partner during private offer creation. ISV can't view Channel Partner's Sales notes and vice versa. |
Related content
- For an overview of analytics reports available in the commercial marketplace, see Access analytic reports for the commercial marketplace in Partner Center.
- For graphs, trends, and values of aggregate data that summarize marketplace activity for your offer, see Summary dashboard in commercial marketplace analytics.
- For information about your orders in a graphical and downloadable format, see Orders dashboard in commercial marketplace analytics.
- For virtual machine (VM) offers usage and metered billing metrics, see Usage Dashboard in commercial marketplace analytics.
- For a list of your download requests over the last 30 days, see Downloads hub in commercial marketplace insights.
- To see a consolidated view of customer feedback for offers on Azure Marketplace and the Microsoft commercial marketplace, see Ratings & Reviews analytics dashboard in Partner Center.
- For frequently asked questions about commercial marketplace analytics and for a comprehensive dictionary of data terms, see Commercial marketplace analytics terminology and common questions.

