View Cache data
This guide shows you how to use DevTools to inspect Cache data.
To inspect HTTP cache data, in the Network tool, use the Size column of the Network Log. See Log network activity in Inspect network activity.
View cache data
Open DevTools by pressing F12 or Ctrl+Shift+I (Windows, Linux) or Command+Option+I (macOS).
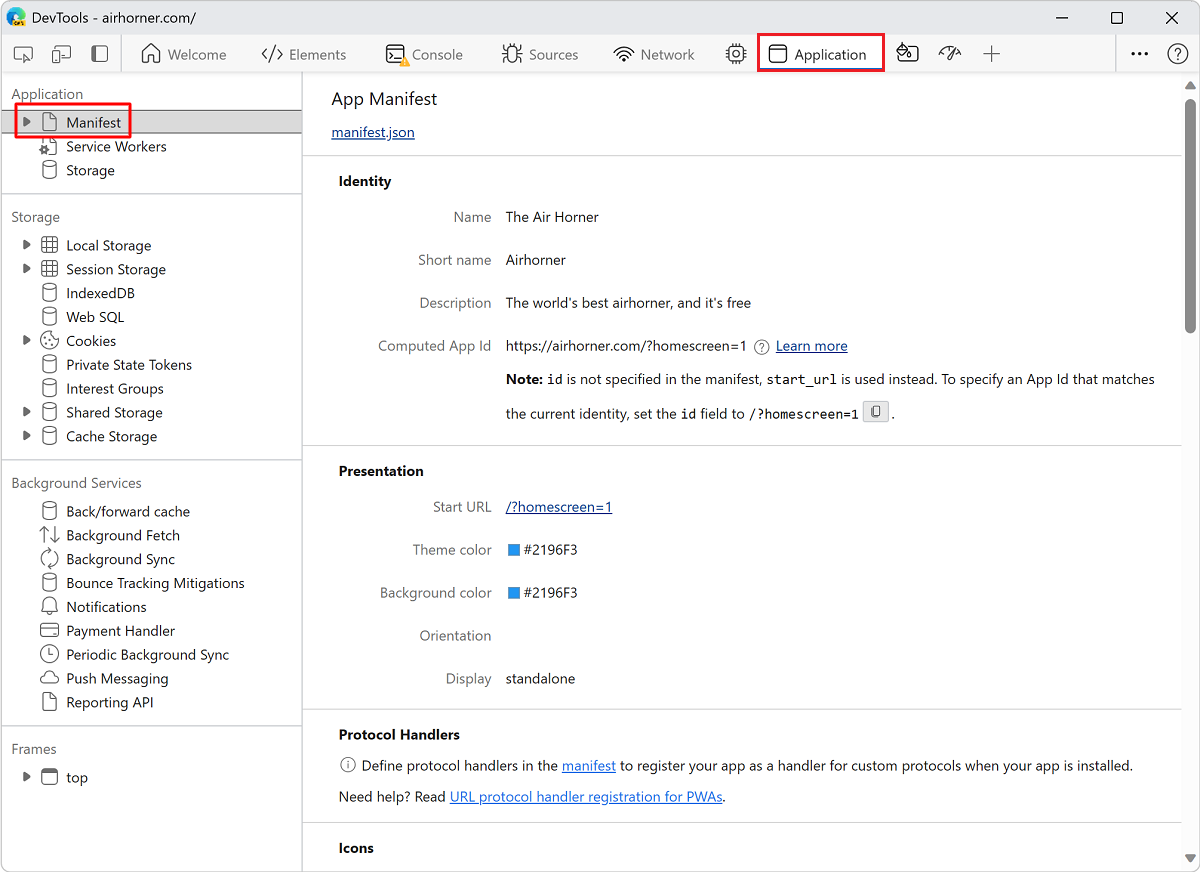
In DevTools, on the Activity Bar, select the Application tab. If that tab isn't visible, click the More tools (
 ) button, and then click Application. The Manifest pane usually opens by default:
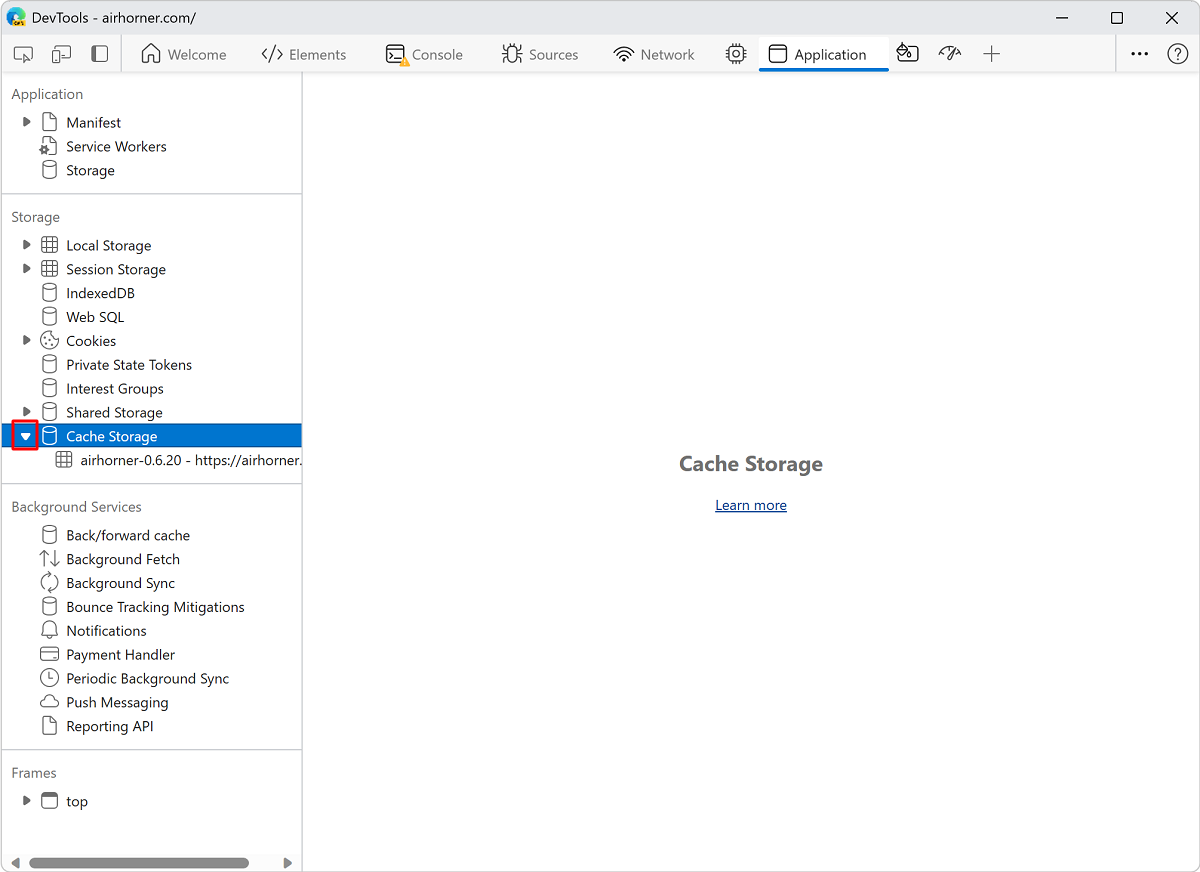
Expand the Cache Storage section to view available caches:
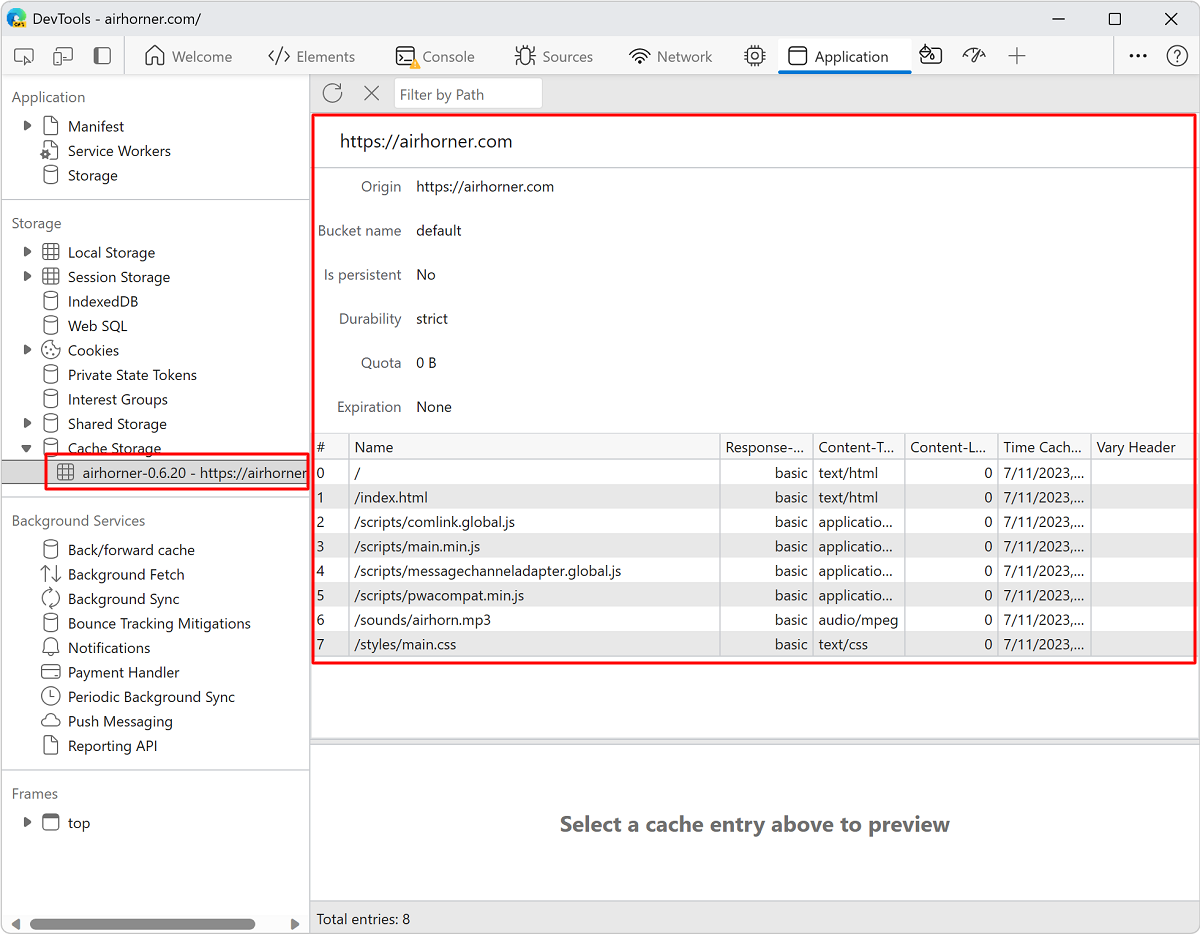
Click a cache to view the contents:
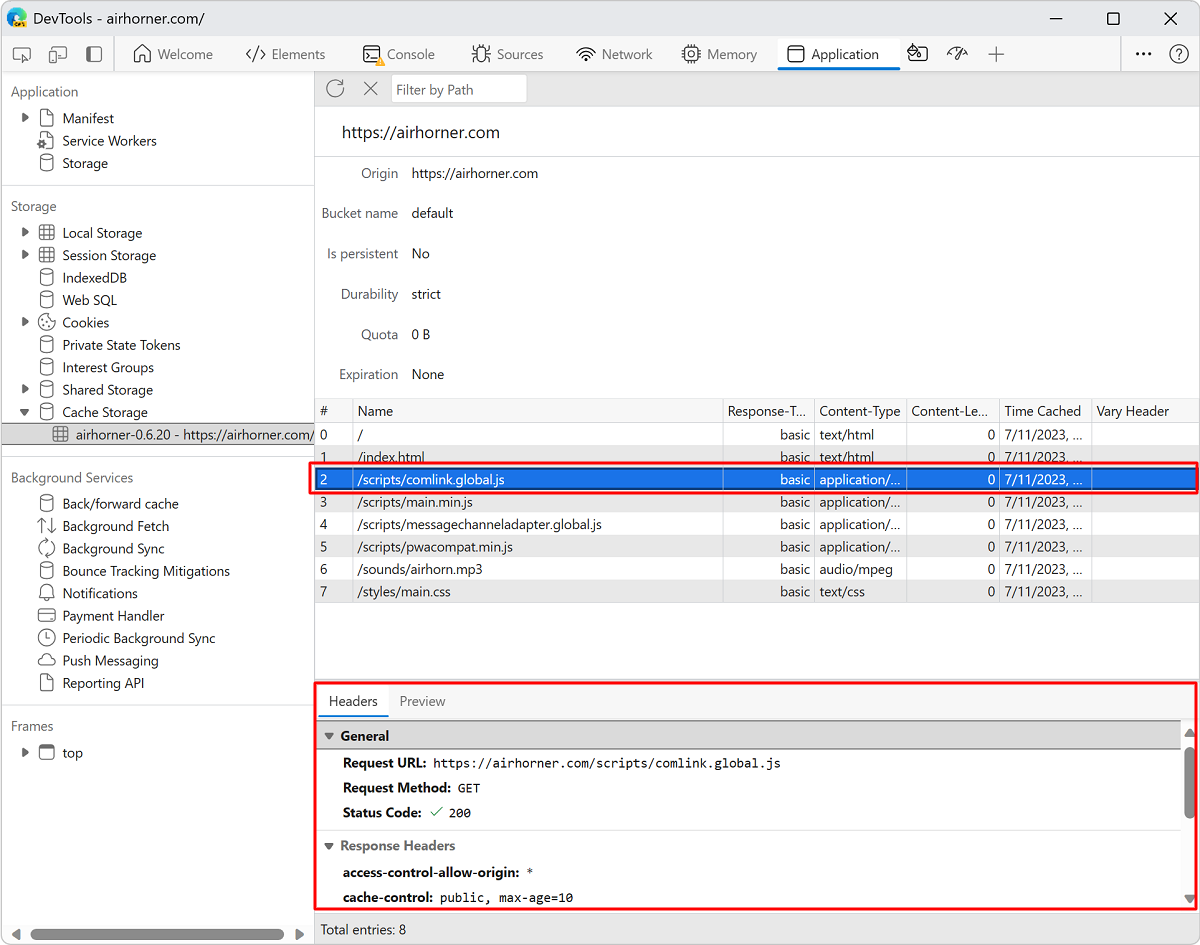
Click a resource to view the HTTP headers in the section below the table:
Click Preview to view the content of a resource:
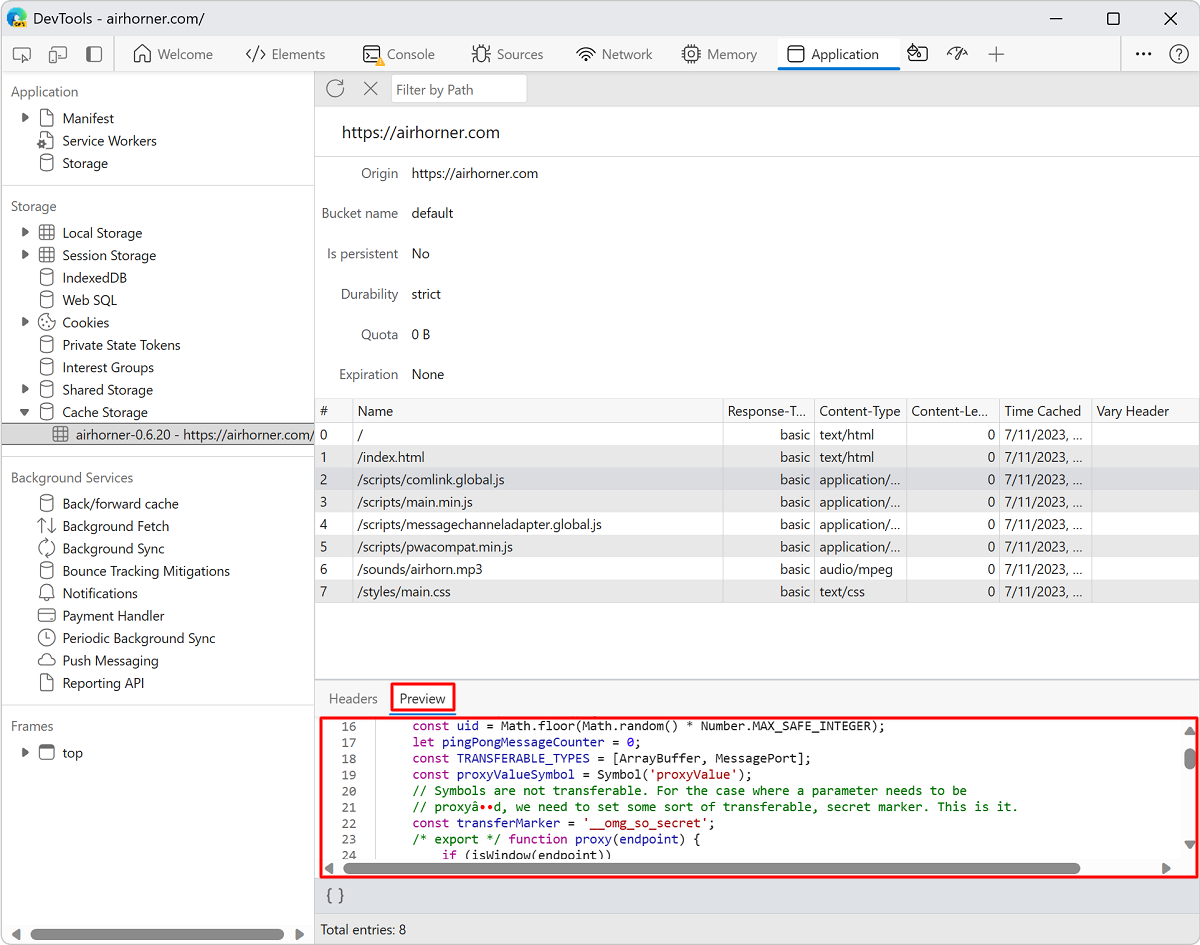
To learn more about cache data storage quota, see Quota usage in Debug a Progressive Web App (PWA).
Refresh a resource
Click the resource that you want to refresh. DevTools highlights it to indicate that it is selected.
Click Refresh (
 ):
):
Filter resources
Use the Filter by Path text box to filter out any resources that don't match the path that you provide:
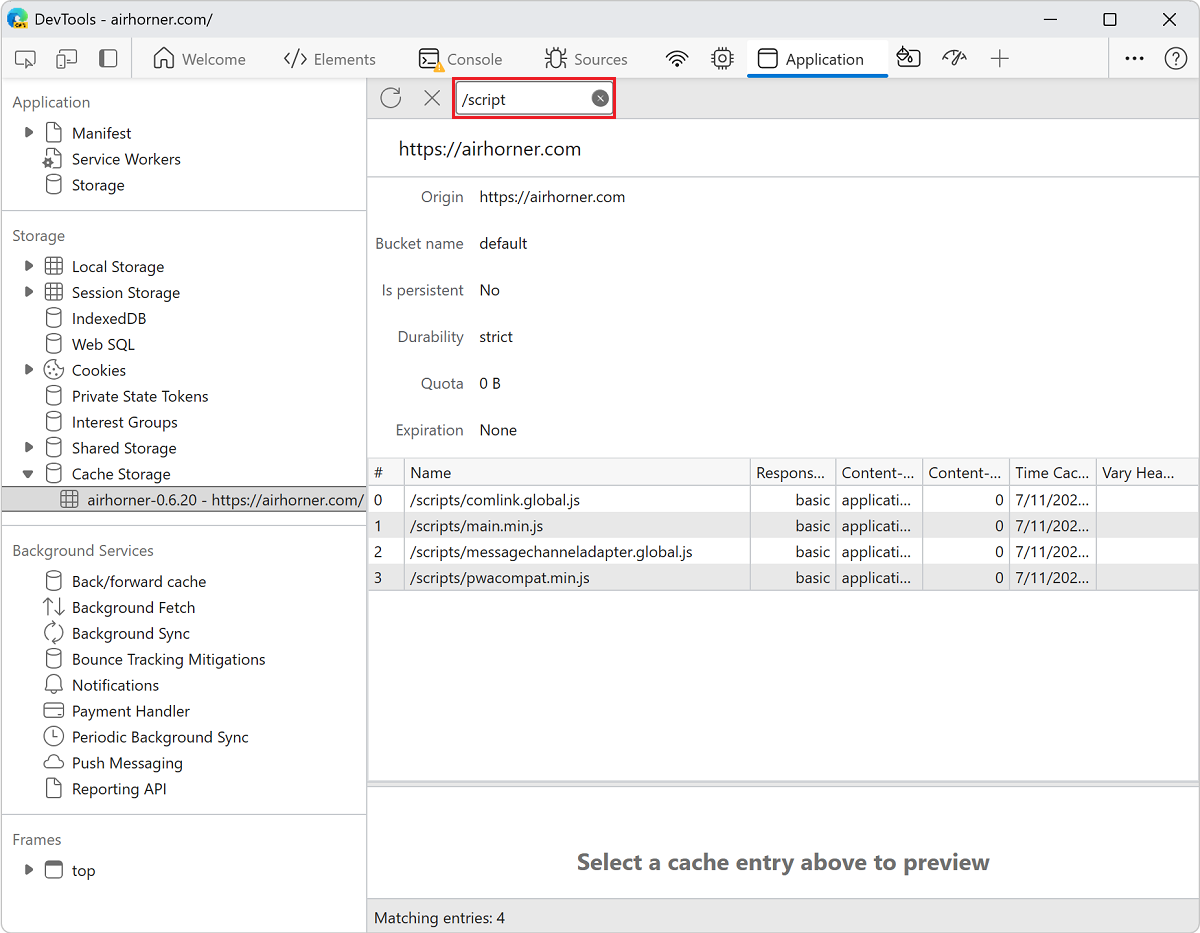
Delete a resource
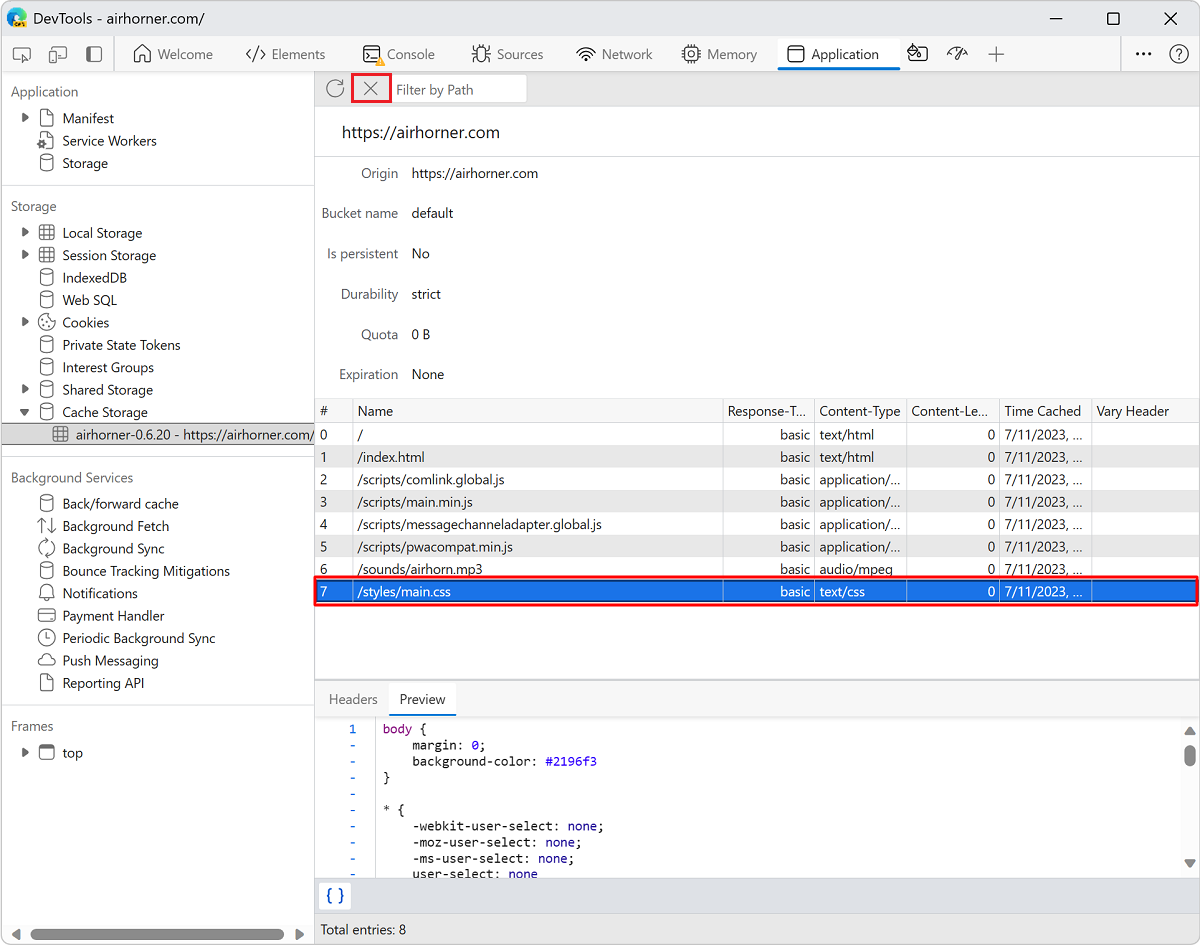
Click the resource that you want to delete. DevTools highlights it to indicate that it is selected.
Click Delete Selected (
 ):
):
Delete all cache data
In the Application tool, click Storage.
Make sure that the Cache storage checkbox is selected.
Click the Clear site data button:
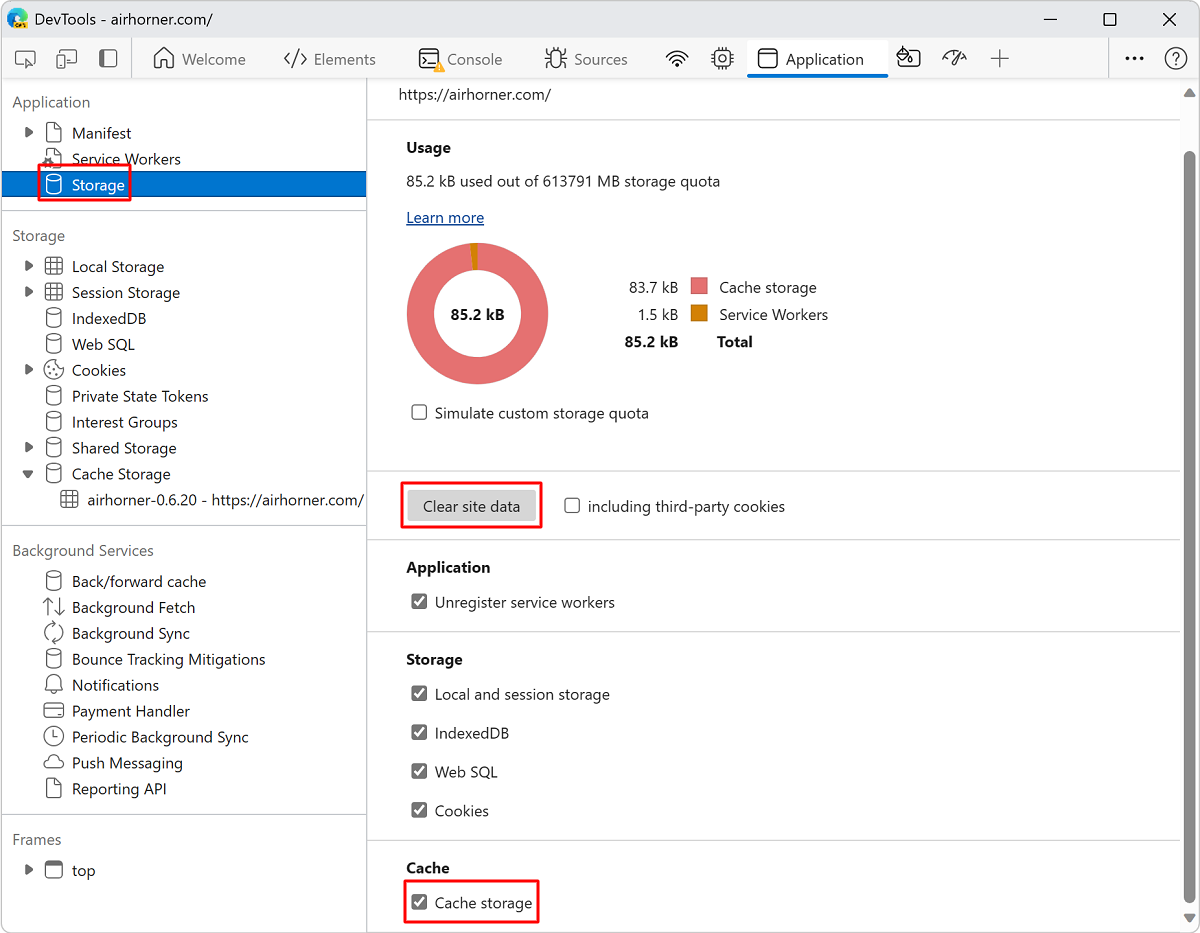
Note
Portions of this page are modifications based on work created and shared by Google and used according to terms described in the Creative Commons Attribution 4.0 International License. The original page is found here and is authored by Kayce Basques.
 This work is licensed under a Creative Commons Attribution 4.0 International License.