Explain Console errors and warnings using Copilot in Edge
To help you understand errors and warnings, the Console tool in Microsoft Edge DevTools integrates Copilot in Microsoft Edge.
When inspecting a webpage with DevTools, you often see errors and warnings in the Console tool. These errors and warnings can sometimes be difficult to understand and fix. By using the Explain this error feature, you get more information about the error or warning in Copilot in Edge:

Video: Explain DevTools Console errors using Copilot in Edge
Supported scenarios
This feature is for use in standard browser windows, and is not available in the following scenarios:
| Scenario | Article |
|---|---|
| Browsing in an InPrivate window | Browse InPrivate in Microsoft Edge |
| Browsing with Kids Mode in Microsoft Edge | Learn more about Kids Mode in Microsoft Edge |
| Using DevTools with a Microsoft Edge WebView2 control | Debug WebView2 apps with Microsoft Edge DevTools |
| Using DevTools in a standalone Progressive Web App window | Use a standalone app window in Best practices for PWAs |
Enable Copilot in Edge
To use this explanation feature, enable Copilot in Edge:
Sign into Microsoft Edge. See Sign in to sync Microsoft Edge across devices.
Make sure the Copilot icon (
 ) is visible in the top-right corner of the browser toolbar. If the Copilot icon isn't displayed, in Microsoft Edge, select Settings and more (...) > Settings > Sidebar > Copilot, and then turn on the Show Copilot toggle.
Explain errors and warnings in the Console tool
To use Copilot to explain an error or warning in the Console tool:
If not done already, enable Copilot in Edge, as described above.
Open a web page that contains the errors you want to explain. For example, open the Console error explainer test page in a new window or tab.
To open DevTools, right-click the webpage, and then select Inspect. Or, press Ctrl+Shift+I (Windows, Linux) or Command+Option+I (macOS). DevTools opens.
In DevTools, on the Activity Bar, select the Console tab.
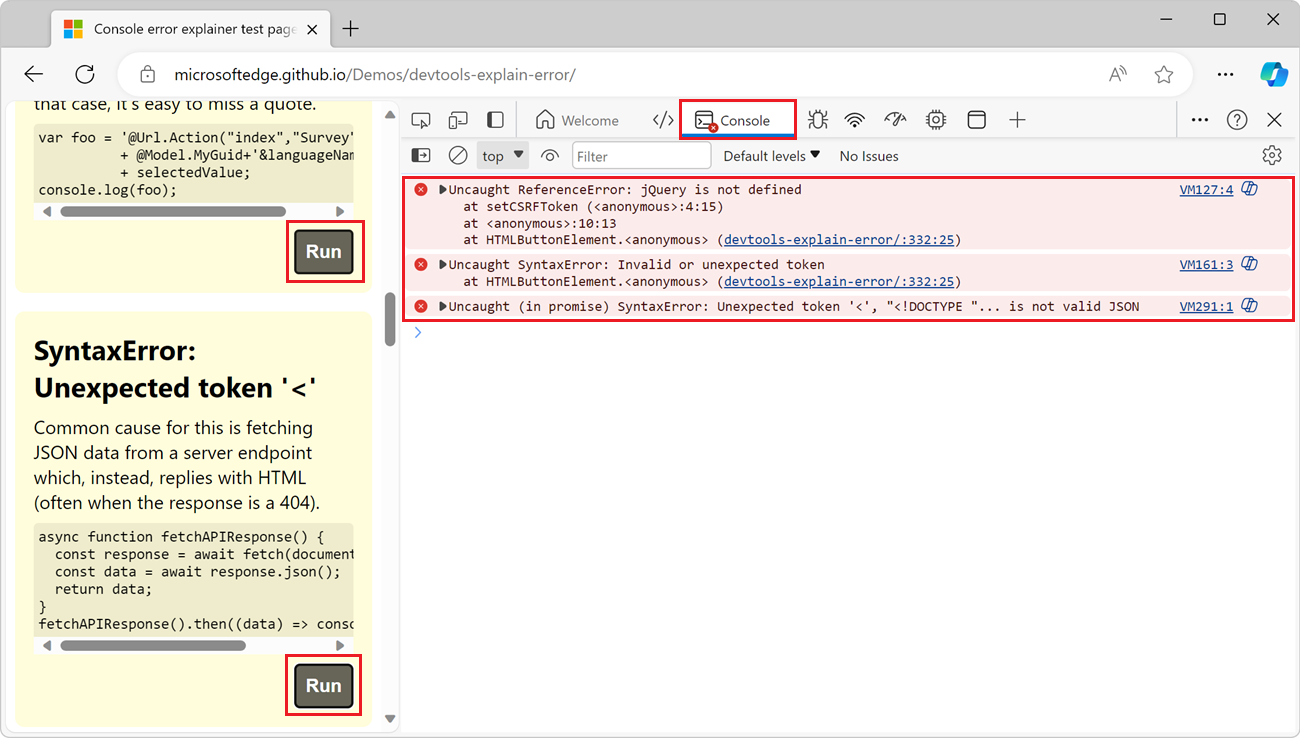
In the rendered web page, click the Run button next to one or more error descriptions.
The demo page then generates errors, which are shown in the Console:

In the Console tool, click the ask Copilot: "Explain this error" (
 ) button next to one of the error messages.
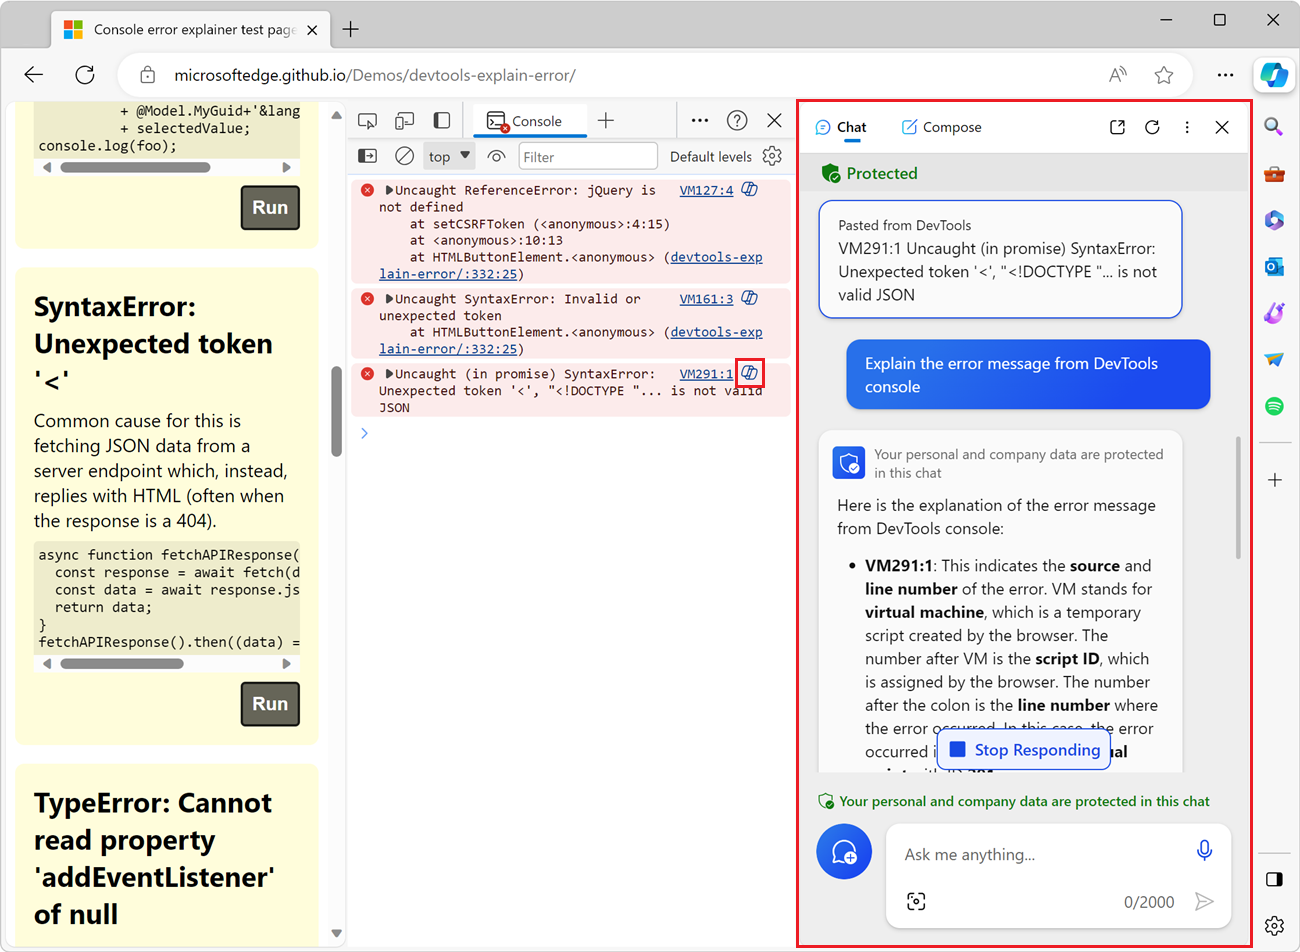
Copilot opens in the Microsoft Edge sidebar, showing the error message, an Explain the error message from DevTools console request message, and then a response explaining the error:

To get more information about the error, in Copilot, enter additional questions.
Provide feedback
The responses that Copilot in Edge provides when you use the above feature are automatically generated, so surprises and mistakes are possible. We're constantly improving the level of quality and accuracy of the responses, but if you see an incorrect response, let us know by adding a comment at: Feedback for the Explain errors and source code in Copilot in Edge experiment.
