Debug your custom code for Unified Service Desk
Using custom code for extending Unified Service Desk involves compiling your custom code into an assembly (DLL file), and then distributing the assembly to the Unified Service Desk client installation directory on each client computer.
Debugging your custom code for Unified Service Desk requires access to the Unified Service Desk client application and Microsoft Dataverse instance with Unified Service Desk solutions deployed.
To effectively debug your custom code, set your Visual Studio project properties to:
Ensure that the latest version of the assembly is copied to the Unified Service Desk client installation directory every time you build your Visual Studio project so that you are testing the executable (the Unified Service Desk client application) using the latest code.
Specify the executable or the calling application (the Unified Service Desk client application) for debugging your code.
To do so:
In your Visual Studio project, from the Project menu, select <Project_Name> Properties.
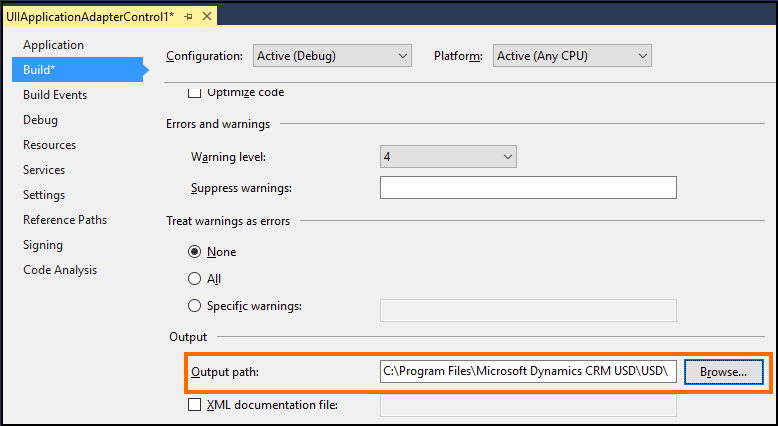
On the Build tab, under the Output area, set the Output path field value to the Unified Service Desk client installation directory, typically C:\Program Files\Microsoft Dynamics CRM USD\USD\.

On the Debug tab, select Start external program, and specify the full path to the
UnifiedServiceDesk.exefile in the field, typically C:\Program Files\Microsoft Dynamics CRM USD\USD\ UnifiedServiceDesk.exe
Save your project.
This ensures that the latest version of the assembly is copied to the Unified Service Desk client installation directory every time you build your project, and the Unified Service Desk client application is automatically started when you debug your project.
Set breakpoints in your Visual Studio project as required, and then build/debug your project.
When the Unified Service Desk client application starts automatically on debugging the project, specify the credentials to connect to your Dataverse instance to continue with the debugging session until you hit a breakpoint or issue in your code.
Additionally, the Debug Output tab of the Debugger hosted control in the Unified Service Desk client application provides real time trace information of the underlying execution, which can be also used to debug your custom code. For more information, see Debug issues in Unified Service Desk
The Debugger hosted control comes pre-configured if you have deployed one of the sample Unified Service Desk packages. Alternatively, you can easily set up the Debugger hosted control in your Unified Service Desk deployment. More information: Walkthrough 6: Configure the Debugger hosted control in your agent application
See also
Extend Unified Service Desk
Unified Service Desk and the UII framework