Configure workspaces for Azure optimization engine
This article explains how to configure Log Analytics workspaces for Azure optimization engine (AOE).
Configure performance counters
If you want to fully use the virtual machine (VM) right-size augmented recommendation, you need to have your VMs sending logs to a Log Analytics workspace. Tt should normally be the one you chose at AOE installation time, but it can be a different one and you need them to send specific performance counters. The list of required counters is defined in the perfcounters.json file (available in the AOE root folder). AOE provides a couple of tools that help you validate and fix the configured Log Analytics performance counters. They depend on the type of agent you're using to collect logs from your machines.
Azure Monitor Agent (preferred approach)
With the help of the Setup-DataCollectionRules.ps1 script, you can create a couple of Data Collection Rules (DCR) - one per OS type - that you configure to stream performance counters to the Log Analytics workspace of your choice. After creating the DCRs with the following script, you just have to manually or automatically (for example, with Azure Policy) associate your VMs to the respective DCRs.
Requirements
Install-Module -Name Az.Accounts
Install-Module -Name Az.Resources
Install-Module -Name Az.OperationalInsights
Usage
./Setup-DataCollectionRules.ps1 -DestinationWorkspaceResourceId <Log Analytics workspace ARM resource ID> [-AzureEnvironment <AzureChinaCloud|AzureUSGovernment|AzureCloud>] [-IntervalSeconds <performance counter collection frequency - default 60>] [-ResourceTags <hashtable with the tag name/value pairs to apply to the DCR>]

# Example 1 - create Linux and Windows DCRs with the default options
./Setup-DataCollectionRules.ps1 -DestinationWorkspaceResourceId "/subscriptions/aaaa0a0a-bb1b-cc2c-dd3d-eeeeee4e4e4e/resourceGroups/myResourceGroup/providers/Microsoft.OperationalInsights/workspaces/myWorkspace"

# Example 2 - create DCRs using a custom counter collection frequency and assigning specific tags
./Setup-DataCollectionRules.ps1 -DestinationWorkspaceResourceId "/subscriptions/aaaa0a0a-bb1b-cc2c-dd3d-eeeeee4e4e4e/resourceGroups/myResourceGroup/providers/Microsoft.OperationalInsights/workspaces/myWorkspace" -IntervalSeconds 30 -ResourceTags @{"tagName"="tagValue";"otherTagName"="otherTagValue"}
Log Analytics agent (legacy Microsoft Monitoring Agent, deprecated on August 31, 2024)
If you're still using the legacy Log Analytics agent, migrate to the Azure Monitor Agent.
Performance logs cost estimation
Each performance counter entry in the Perf table has different sizings, depending on the seven required counters per OS type. The following table enumerates the size (in bytes) per performance counter entry.
| OS Type | Object | Counter | Size | Collections per interval/VM |
|---|---|---|---|---|
| Windows | Processor | % Processor Time | 200 | 1 + vCPUs count |
| Windows | Memory | Available MBytes | 220 | 1 |
| Windows | LogicalDisk | Disk Read Bytes/sec | 250 | 3 + data disks count |
| Windows | LogicalDisk | Disk Write Bytes/sec | 250 | 3 + data disks count |
| Windows | LogicalDisk | Disk Reads/sec | 250 | 3 + data disks count |
| Windows | LogicalDisk | Disk Writes/sec | 250 | 3 + data disks count |
| Windows | Network Adapter | Bytes Total/sec | 290 | network adapters count |
| Linux | Processor | % Processor Time | 200 | |
| Linux | Memory | % Used Memory | 200 | |
| Linux | Logical Disk | Disk Read Bytes/sec | 250 | 3 + data disks count |
| Linux | Logical Disk | Disk Write Bytes/sec | 250 | 3 + data disks count |
| Linux | Logical Disk | Disk Reads/sec | 250 | 3 + data disks count |
| Linux | Logical Disk | Disk Writes/sec | 250 | 3 + data disks count |
| Linux | Network | Total Bytes | 200 | network adapters count |
In summary, a Windows VM generates, in average, 245 bytes per performance counter entry, while a Linux consumes a bit less, 230 bytes per entry. However, depending on the number of CPU cores, data disks, or network adapters, a VM generates more or less Log Analytics entries. For example, a Windows VM with 4 vCPUs, 1 data disk and 5 network adapters generates 5 * 200 + 220 + 4 * 250 + 4 * 250 + 4 * 250 + 4 * 250 + 5 * 290 = 6670 bytes (6.5 KB) per collection interval. If you set your Performance Counters interval to 60 seconds, then you have 60 * 24 * 30 * 6.5 = 280800 KB (274 MB) of ingestion data per month. It means it costs less than 0.70 EUR/month at the Log Analytics retail price (Pay As You Go) for ingestion.
Using multiple workspaces for performance logs
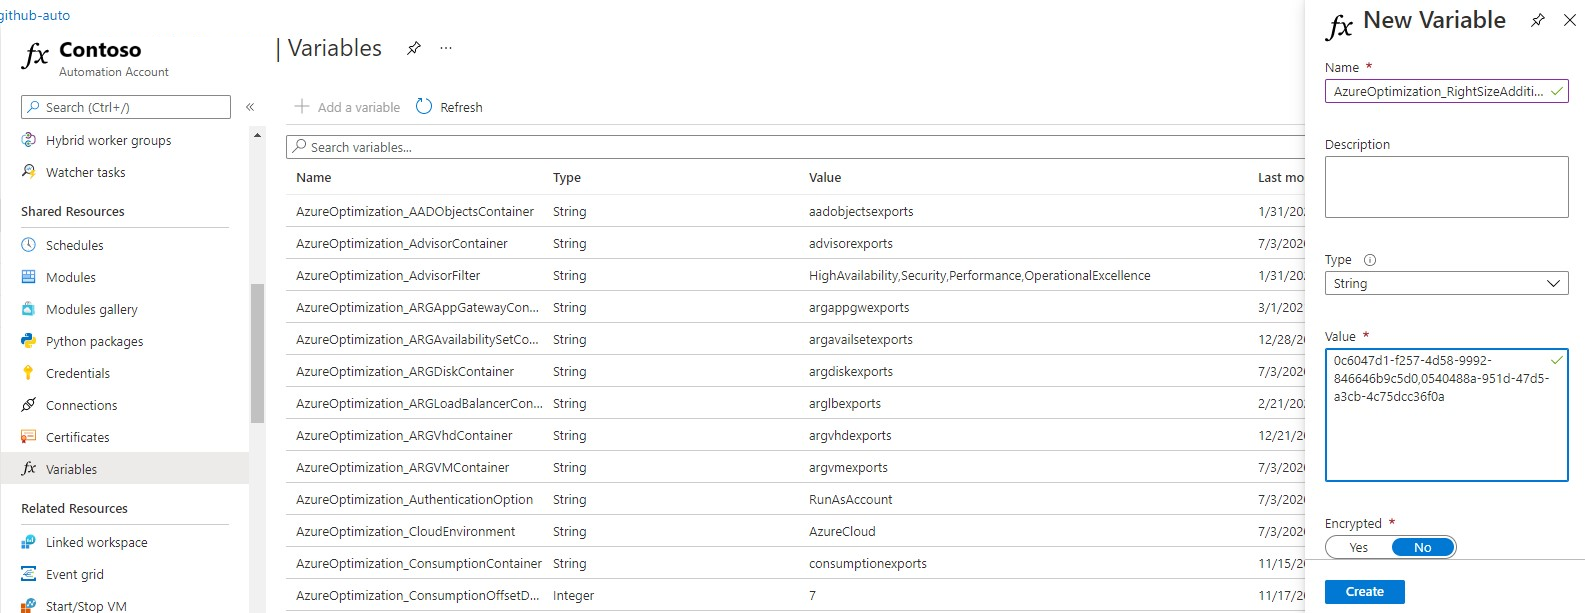
To include VMs from multiple Log Analytics workspaces in the VM right-size recommendations report, add a new variable to the AOE Azure Automation account. You can add any workspace to the scope of AOE, provided the AOE Managed Identity has Reader permissions over that workspace. The workspace can be in the same subscription or in any other subscription in the same tenant or even in a different tenant (with the help of Lighthouse).
Related content
Related products:
Related solutions:
